

Mathematics, 20.01.2021 18:50, christson805
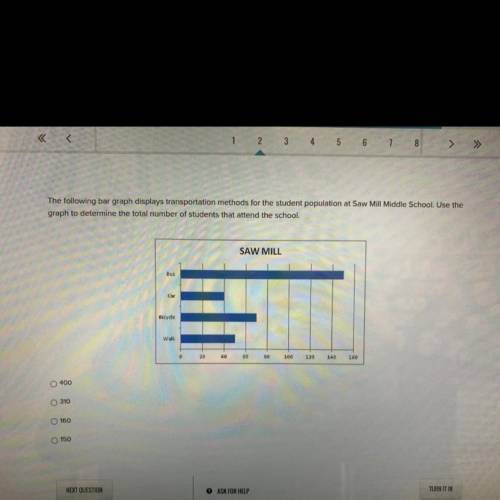
The following bar graph displays transportation methods for the student population at Saw Mill Middle School. Use the
graph to determine the total number of students that attend the school.
SAW MILL
Bus
Car
Bicycle
Walk
60
20
80
40
100
140
120
160
0
O 400
310
160
O 150

Answers: 2


Other questions on the subject: Mathematics
Mathematics, 21.06.2019 17:10, tdahna0403
The graph of g(x) is a translation of y = which equation represents g(x)?
Answers: 1
Do you know the correct answer?
The following bar graph displays transportation methods for the student population at Saw Mill Middl...
Questions in other subjects:

Social Studies, 18.03.2021 02:10

English, 18.03.2021 02:10
Mathematics, 18.03.2021 02:10

Mathematics, 18.03.2021 02:10

Spanish, 18.03.2021 02:10


