


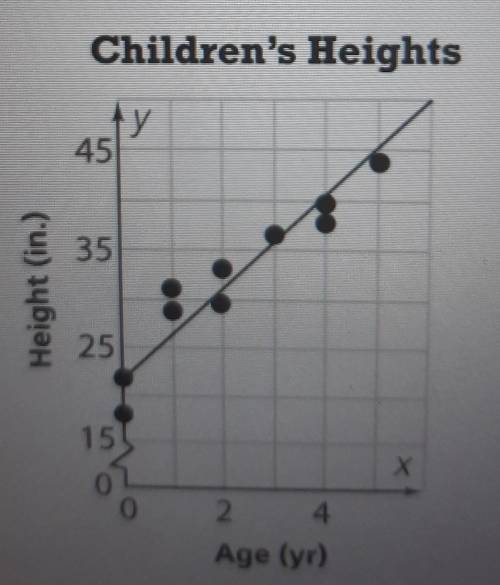
The scatter plot shows the average heights of children up to age 5.
Part A
Drag numbers to com...

Mathematics, 20.01.2021 02:00, gl648809
The scatter plot shows the average heights of children up to age 5.
Part A
Drag numbers to complete an equation for the trend line. Numbers may be used once, more than once, or not at all.
(22, 2.5, 18, 32, 4.5)
y = ?x + ?
Part B
Using the linear equation, predict the average height for a two-year old.
A. 15 inches
B. 22 inches
C. 31 inches
D. 35 inches

Answers: 3
Other questions on the subject: Mathematics
Mathematics, 21.06.2019 17:00, Niyah3406
When you are making a circle graph by hand, how do you convert a number for a part into its corresponding angle measure in the circle graph? when you are making a circle graph by hand, what should you do if one of your angle measures is greater than 180°?
Answers: 2
Mathematics, 21.06.2019 18:00, CarQuestionl506
If a translation of t-3,-8(x, y) is applied to square abcd what is the y-coordinate of b'? the y-coordinate of is 43 mark this and return save and exit next submit
Answers: 1
Mathematics, 21.06.2019 22:00, foreverrocky12p2asun
Consider the triangle. which shows the order of the angles from smallest to largest? angle a, angle b, angle c angle b, angle a, angle c angle b, angle c, angle a angle c, angle a, angle b
Answers: 3
Do you know the correct answer?
Questions in other subjects:
Mathematics, 13.04.2021 20:20

Computers and Technology, 13.04.2021 20:20

Mathematics, 13.04.2021 20:20

English, 13.04.2021 20:20
English, 13.04.2021 20:20


