Mathematics, 19.01.2021 22:10, khemphill4118
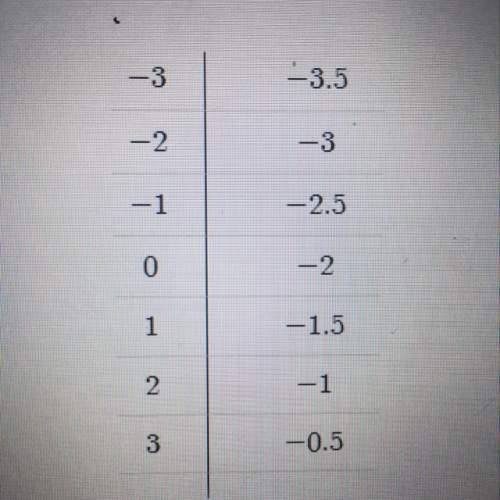
A researcher compared the heights and shoe sizes for 50 men, selected at random. The equation shown describes a line of best fit for the data, where x is the shoe size and y is the height, in inches

Answers: 3
Other questions on the subject: Mathematics

Mathematics, 21.06.2019 18:40, banditballer2
Complete the steps, which describe how to find the area of the shaded portion of the circle. find the area of the sector by multiplying the area of the circle by the ratio of the to 360. subtract the area of the triangle from the area of the sector.
Answers: 3


Do you know the correct answer?
A researcher compared the heights and shoe sizes for 50 men, selected at random. The equation shown...
Questions in other subjects:


Mathematics, 23.01.2021 07:00

Mathematics, 23.01.2021 07:00


Social Studies, 23.01.2021 07:00


