


Five observations taken for two variables follow.
xi 4 6 11 3 16
yi 50 50 40 60 30
a....

Mathematics, 19.01.2021 19:00, izzy201995
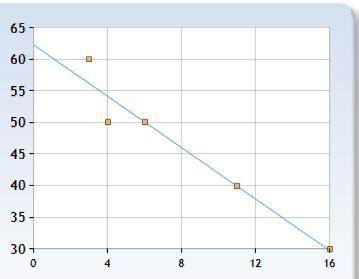
Five observations taken for two variables follow.
xi 4 6 11 3 16
yi 50 50 40 60 30
a. Develop a scatter diagram with x on the horizontal axis.
b. What does the scatter diagram developed in part (a) indicate about the relationship
between the two variables?
c. Compute and interpret the sample covariance.
d. Compute and interpret the sample correlation coefficient.

Answers: 3
Other questions on the subject: Mathematics
Mathematics, 21.06.2019 12:30, ineedhelpplz40
Katlyn made 4 dresses with 7 yards of fabric. how many yards did she use on 1 dress?
Answers: 2
Mathematics, 21.06.2019 15:30, evalentine843
Write the expression in simplified radical form. show all steps and work including any foil method work. (hint: use the conjugate. no decimal answers.) (9-2√3)/(12+√3)
Answers: 1
Do you know the correct answer?
Questions in other subjects:

History, 06.11.2021 02:30
Mathematics, 06.11.2021 02:30


Geography, 06.11.2021 02:30


