


Hi, can you please help me with this math project
I have to graph a rollercoaster
The f...

Mathematics, 18.01.2021 14:00, sophiateaches053
Hi, can you please help me with this math project
I have to graph a rollercoaster
The first part of the ride is modelled by a polynomial function. It includes a steep
hill that starts at the origin, where the cars obtain their initial energy.
Your curve must pass through the point (5, 15)
The second part of the ride is modelled by a sinusoidal function with at least two
cycles.
The third part of the ride is modelled by a rational function that brings the cars
back close to the ground.
The functions may not connect at a local maximum or minimum point.
The dimensions of the roller coaster must be realistic. (Max possible height: 90metres)
The rates of change where one part of the ride meets another part of the ride
must not differ by more than 10%.
a) Determine an equation for each part of the ride.
b) Graph all three equations and show how they join each other. Label the points of
intersection with their coordinates. The horizontal axis should be horizontal
distance. The vertical axis should be vertical distance.
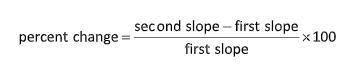
c) Using hand-written calculations, determine the instantaneous rates of change on
either side of each intersection point, and show that the rates of change at each
intersection points do not differ by more than 10%. Use this equation for percent
change: (check the image uploaded)
All calculations of IROCs and percent change must be hand-written!

Answers: 1
Other questions on the subject: Mathematics
Mathematics, 21.06.2019 16:10, DepressionCentral
Which of the following graphs represents the function f(x) = 2^x
Answers: 2
Mathematics, 21.06.2019 19:20, ayeofaygo5168
The fraction of defective integrated circuits produced in a photolithography process is being studied. a random sample of 300 circuits is tested, revealing 17 defectives. (a) calculate a 95% two-sided confidence interval on the fraction of defective circuits produced by this particular tool. round the answers to 4 decimal places. less-than-or-equal-to p less-than-or-equal-to (b) calculate a 95% upper confidence bound on the fraction of defective circuits. round the answer to 4 decimal places. p less-than-or-equal-to
Answers: 3
Do you know the correct answer?
Questions in other subjects:

Social Studies, 20.05.2021 14:00

Biology, 20.05.2021 14:00
Mathematics, 20.05.2021 14:00

History, 20.05.2021 14:00
Social Studies, 20.05.2021 14:00
Mathematics, 20.05.2021 14:00

Spanish, 20.05.2021 14:00
History, 20.05.2021 14:00
Mathematics, 20.05.2021 14:00


