

Mathematics, 18.01.2021 08:10, dnarioproctor
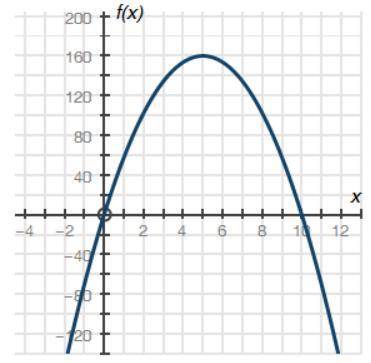
The graph below shows a company's profit f(x), in dollars, depending on the price of pencils x, in dollars, sold by the company:
Graph of quadratic function f of x having x intercepts at ordered pairs negative 0, 0 and 10, 0. The vertex is at 5, 160.
Part A: What do the x-intercepts and maximum value of the graph represent? What are the intervals where the function is increasing and decreasing, and what do they represent about the sale and profit?
Part B: What is an approximate average rate of change of the graph from x = 2 to x = 5, and what does this rate represent?
Part C: Describe the constraints of the domain.

Answers: 2


Other questions on the subject: Mathematics
Mathematics, 21.06.2019 20:00, maddie53116
Formulate alisha has a number in mind. if she adds three to her number the result is less than five. use this information to write and solve an inequality about alisha's number. then graph the solution set.
Answers: 1
Do you know the correct answer?
The graph below shows a company's profit f(x), in dollars, depending on the price of pencils x, in d...
Questions in other subjects:


History, 24.03.2021 16:30

History, 24.03.2021 16:30

Mathematics, 24.03.2021 16:30


