

Mathematics, 16.01.2021 04:10, AbbyNeil
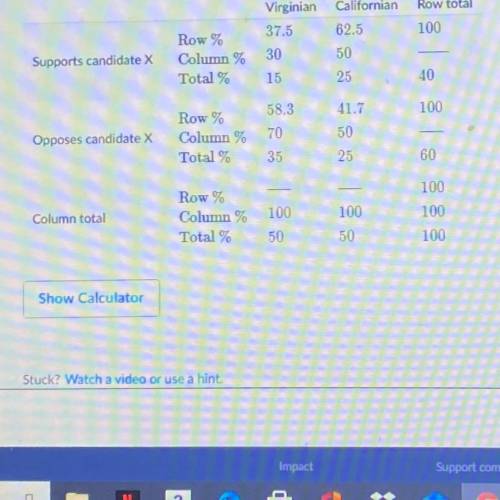
The relative frequency table below summarizes a survey about support for candidate X in an upcoming national
election. In this survey, 210 randomly selected Virginians opposed candidate X.
How many people in this survey were Californians who opposed candidate X?
Does the table show evidence of an association between being from Virginia and opposing candidate X?
Choose all answers that apply:
Yes, because Virginians who oppose candidate X have the smallest joint relative frequency.
B
Yes, because 58.3% of people who oppose candidate X are from Virginia, but only 50% of all
people in the study are from Virginia.
Yes, because 70% of Virginians oppose candidate X but only 58.3% of people who oppose
candidate X are Virginians.
D
Yes, because 70% of Virginians oppose candidate X, but only 60% of all people oppose him.
No, because the total column percentages are equal.

Answers: 3


Other questions on the subject: Mathematics
Mathematics, 21.06.2019 14:00, kah36
When drawing a trend line for a series of data on a scatter plot, which of the following is true? a. there should be an equal number of data points on either side of the trend line. b. all the data points should lie on one side of the trend line. c. the trend line should not intersect any data point on the plot. d. the trend line must connect each data point on the plot.
Answers: 2
Mathematics, 21.06.2019 16:00, emilyblaxton
Pick the expression that matches this description: a polynomial of the 5th degree with a leading coefficient of 7 and a constant term of 6 (choice a) 7x^5+2x^2+6 (choice b) 7x^6−6x^4+5 (choice c) 6x^7−x^5+5 (choice d) 6x^5+x^4+7
Answers: 2
Mathematics, 21.06.2019 20:00, faithyholcomb
Someone answer asap for ! max recorded the heights of 500 male humans. he found that the heights were normally distributed around a mean of 177 centimeters. which statements about max’s data must be true? a. the median of max’s data is 250 b. more than half of the data points max recorded were 177 centimeters. c. a data point chosen at random is as likely to be above the mean as it is to be below the mean. d. every height within three standard deviations of the mean is equally likely to be chosen if a data point is selected at random.
Answers: 1
Do you know the correct answer?
The relative frequency table below summarizes a survey about support for candidate X in an upcoming...
Questions in other subjects:


Law, 12.03.2021 20:50
English, 12.03.2021 20:50

Computers and Technology, 12.03.2021 20:50
Mathematics, 12.03.2021 20:50
English, 12.03.2021 20:50
Mathematics, 12.03.2021 20:50


