

Mathematics, 16.01.2021 03:30, P4thing
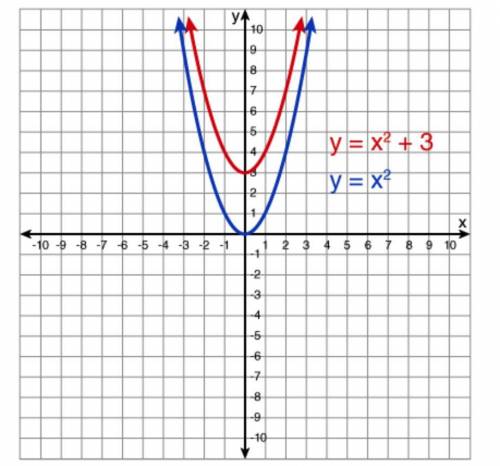
A quadratic function models the graph of a parabola. The quadratic functions, y = x2 and y = x2 + 3, are modeled in the graphs of the parabolas shown below.
Determine which situations best represent the scenario shown in the graph of the quadratic functions, y = x2 and y = x2 + 3. Select all that apply.
From x = -2 to x = 0, the average rate of change for both functions is negative
For the quadratic function, y = x2, the coordinate (2, 3) is a solution to the equation of the function.
The quadratic function, y = x2 + 3, has an x-intercept at the origin
The quadratic function, y = x2, has an x-intercept at the origin
From x = -2 to x = 0, the average rate of change for both functions is positive
For the quadratic function, y = x2 + 3, the coordinate (2, 7) is a solution to the equation of the function.

Answers: 1


Other questions on the subject: Mathematics
Mathematics, 21.06.2019 18:40, icantspeakengles
Does the point (1, sqrt 7) lie on circle shown.
Answers: 1
Do you know the correct answer?
A quadratic function models the graph of a parabola. The quadratic functions, y = x2 and y = x2 + 3,...
Questions in other subjects:

History, 06.11.2020 22:30
History, 06.11.2020 22:30

Mathematics, 06.11.2020 22:30

Biology, 06.11.2020 22:30


