


This graph shows the solution to which inequality?
5
(3,2)
5
(-3,-6)
O A. y...

Mathematics, 15.01.2021 19:40, motionlessinwhite18
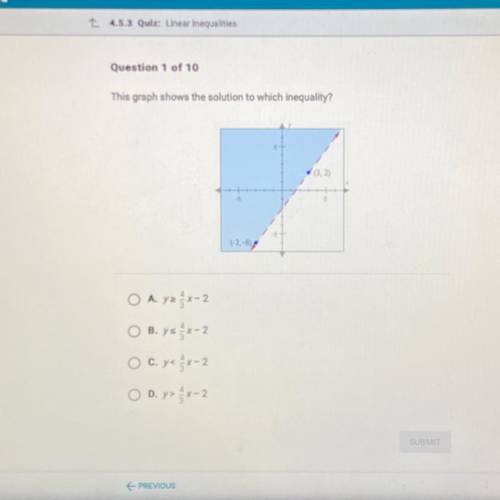
This graph shows the solution to which inequality?
5
(3,2)
5
(-3,-6)
O A. yx-2
OB. ysx-2
O c. y< x-2
OD. y -2

Answers: 3
Other questions on the subject: Mathematics
Mathematics, 21.06.2019 22:10, alishadautreuil
In which direction does the left side of the graph of this function point? a(x) = 3x - x2 + 4x - 2
Answers: 3
Mathematics, 21.06.2019 22:30, nane718
According to the 2008 u. s. census, california had a population of approximately 4 × 10^7 people and florida had a population of approximately 2 × 10^7 people. which of the following is true? a. the population of california was approximately two times the population of florida. b. the population of florida was approximately twenty times the population of california. c. the population of florida was approximately two times the population of california. d. the population of california was approximately twenty times the population of florida.
Answers: 1
Do you know the correct answer?
Questions in other subjects:
Mathematics, 28.08.2019 07:30


English, 28.08.2019 07:30

Mathematics, 28.08.2019 07:30
English, 28.08.2019 07:30


