

Mathematics, 15.01.2021 02:10, beckytank6338
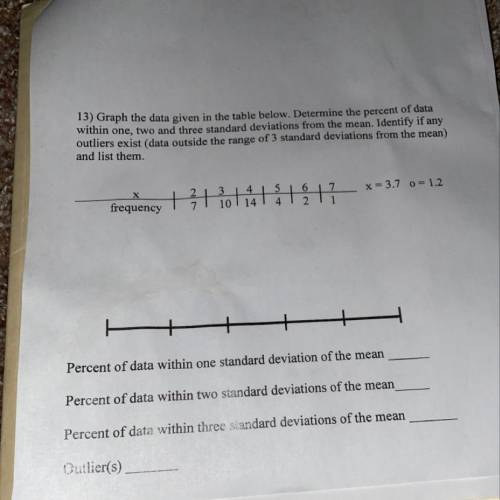
13) Graph the data given in the table below. Determine the percent of data
within one, two and three standard deviations from the mean. Identify if any
outliers exist (data outside the range of 3 standard deviations from the mean)
and list them.

Answers: 1


Other questions on the subject: Mathematics
Mathematics, 22.06.2019 01:20, allenlitterell
32a³b² 8ab² simplify the following expression.
Answers: 1
Mathematics, 22.06.2019 01:50, monstergirl25
Thomas is using a drawing program to complete a construction. which construction could he be completing? two perpendicular lines are drawn. inscribing an equilateral triangle in a circle inscribing a square in a circle inscribing a regular pentagon in a circle inscribing a regular hexagon in a circle
Answers: 1
Do you know the correct answer?
13) Graph the data given in the table below. Determine the percent of data
within one, two and thr...
Questions in other subjects:


Mathematics, 18.08.2021 01:20

Mathematics, 18.08.2021 01:20

Advanced Placement (AP), 18.08.2021 01:20


