


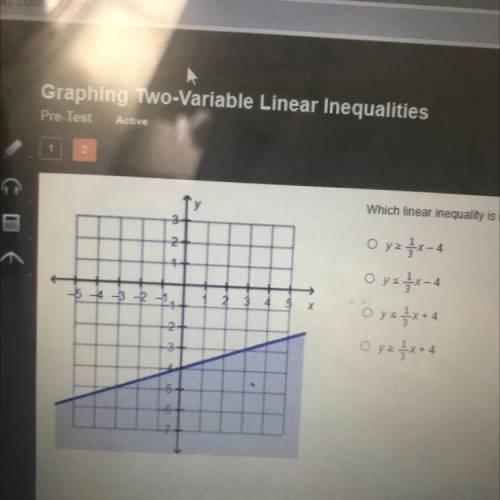
Which linear inequality is represented by the graph?
>
O y>_1/3x-4
Oy<_1/3x-4<...

Mathematics, 14.01.2021 20:00, Wolfb21345
Which linear inequality is represented by the graph?
>
O y>_1/3x-4
Oy<_1/3x-4
Oy<_1/3x+4
O y>_1/3x+4
Which linear inequality is represent by the graph?

Answers: 1
Other questions on the subject: Mathematics
Mathematics, 21.06.2019 13:00, JonJon05
Which of the following situations represents a linear relationship? a. theresa increases the distance she runs by 0.1 miles every week. b. the volume of a box depends on the length of box. c. the amount of money in a bank account increases by 1 percent each year. d. the population of a town doubles every 5 years.
Answers: 3
Mathematics, 21.06.2019 15:30, jermainedwards
Divide: 1573 ÷ 7 = a) 222 r5 b) 223 r6 c) 224 r5 d) 224 r3
Answers: 2
Do you know the correct answer?
Questions in other subjects:
Mathematics, 01.03.2021 14:50
Mathematics, 01.03.2021 14:50
Mathematics, 01.03.2021 14:50


History, 01.03.2021 15:00

Mathematics, 01.03.2021 15:00


