
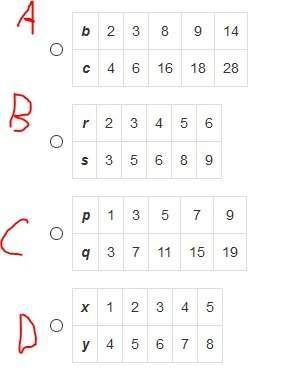


This table represents a function.
Plot points to represent the function as a graph.
X
y...

Mathematics, 14.01.2021 14:00, Unstinct
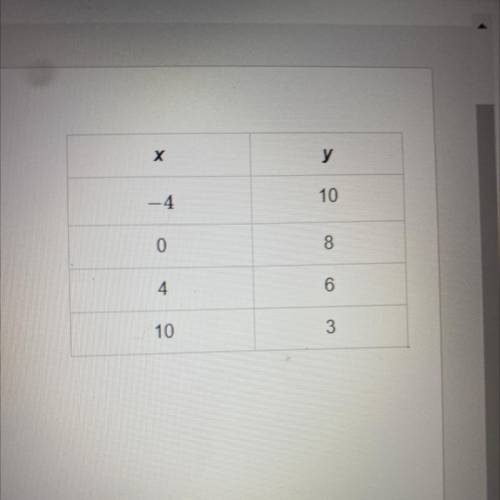
This table represents a function.
Plot points to represent the function as a graph.
X
y
-4
10
0
8
10
4
6
9
10
3
3
7
6
5
4
3
3
2
1
-4
3
-2
-10
1
2
3
4
5
6
7
8
9
10
-1
-2
-3
4
-5

Answers: 3
Other questions on the subject: Mathematics
Mathematics, 21.06.2019 20:00, paulesparsa6
Given the two similar triangles, how do i find the missing length? if a=4, b=5, and b'=7.5 find a'
Answers: 1
Mathematics, 21.06.2019 23:50, ChessieGiacalone
How are algebraic expressions evaluated using substitution?
Answers: 1
Do you know the correct answer?
Questions in other subjects:


Spanish, 22.04.2021 23:10
Mathematics, 22.04.2021 23:10


Geography, 22.04.2021 23:10
Mathematics, 22.04.2021 23:10


