

Mathematics, 14.01.2021 09:30, tasiajm
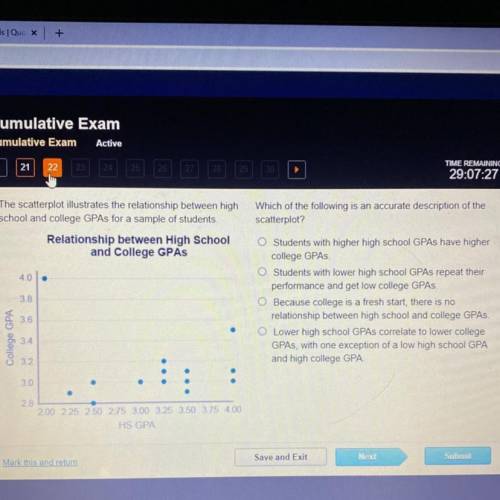
The scatterplot illustrates the relationship between high
school and college GPAs for a sample of students.
Which of the following is an accurate description of the
scatterplot?
Relationship between High School
and College GPAS
4.0
3.8
Students with higher high school GPAs have higher
college GPAs.
O Students with lower high school GPAs repeat their
performance and get low college GPAs.
O Because college is a fresh start, there is no
relationship between high school and college GPAs.
O Lower high school GPAs correlate to lower college
GPAs, with one exception of a low high school GPA
and high college GPA.
3.6
College GPA
3.4
32
3.0
2.8
200 225 2.50 2.75 3.00 3.25 3.50 3.75 4.00
HS GPA
Mark this and return
Save and Exit
Next
Submit

Answers: 2


Other questions on the subject: Mathematics
Mathematics, 21.06.2019 13:00, vanleervanleer
Look at this expression. a3b3c a-3b-3c-1 which of the following is the simplest form of the expression above?
Answers: 2
Mathematics, 21.06.2019 20:00, nauticatyson9
If private savings 'v' = 0.75s and total savings 's' equals $4.20 billion, solve for public and private savings.
Answers: 2
Do you know the correct answer?
The scatterplot illustrates the relationship between high
school and college GPAs for a sample of s...
Questions in other subjects:
Mathematics, 24.08.2021 18:20

Spanish, 24.08.2021 18:20
Mathematics, 24.08.2021 18:20

Computers and Technology, 24.08.2021 18:20


History, 24.08.2021 18:20

Mathematics, 24.08.2021 18:20


