

Mathematics, 14.01.2021 02:10, rakanmadi87
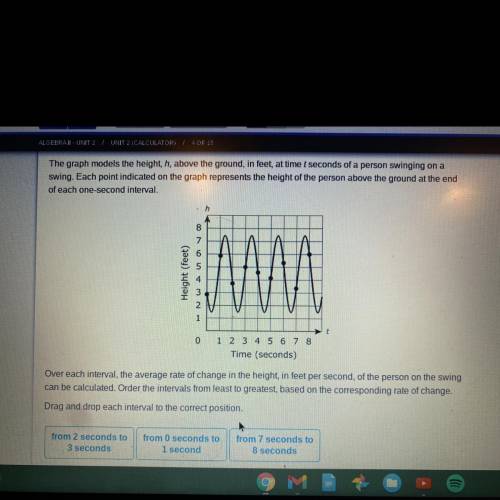
The graph models the height, h, above the ground, in feet, at time t seconds of a person swinging on a
swing. Each point indicated on the graph represents the height of the person above the ground at the end
of each one-second interval.
8
Height (feet)
NWAV
1
0
1 2 3 4 5 6 7 8
Time (seconds)
Over each interval, the average rate of change in the height, in feet per second, of the person on the swing
can be calculated. Order the intervals from least to greatest, based on the corresponding rate of change.
Drag and drop each interval to the correct position.

Answers: 2


Other questions on the subject: Mathematics
Mathematics, 21.06.2019 17:30, lamanihill
Aplot of land is shaped like a quadrilateral. fences are built on the diagonal to divide the area into 4 sections. what is vi to the nearest tenth? gv = 6.55fv = 5.84vh = 3.27vi = ?
Answers: 1
Mathematics, 21.06.2019 17:30, BreBreDoeCCx
If the class was going to get a class pet and 5 picked fish and 7 pick bird and 8 picked rabbits have many students were in the
Answers: 1
Mathematics, 21.06.2019 18:30, jamalnellum56
The square pyramid has a volume of 441 cubic inches. what is the value of x? 1/7x is the height x is the base
Answers: 2
Mathematics, 21.06.2019 20:00, martinezjulio1976
Use the elimination method to solve the systems of equations. choose the correct ordered pair. 7x+4y=39
Answers: 1
Do you know the correct answer?
The graph models the height, h, above the ground, in feet, at time t seconds of a person swinging on...
Questions in other subjects:
Mathematics, 19.04.2021 01:00
Mathematics, 19.04.2021 01:00

Social Studies, 19.04.2021 01:00
Mathematics, 19.04.2021 01:00
Mathematics, 19.04.2021 01:00
Mathematics, 19.04.2021 01:00


