

Mathematics, 13.01.2021 17:10, brooklynmikestovgphx
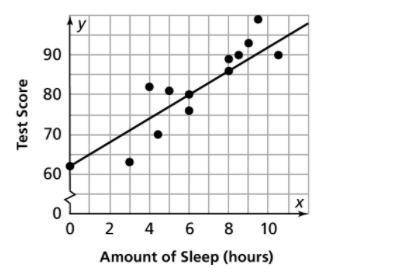
The scatterplot shows the amount of sleep that Aria got the night before a test and her test scores. What type of relationship do you see between amount of sleep and test scores?
A. In general, Aria scores lower on a test when she sleeps more and scores higher on a test when she sleeps less.
B. In general, Aria scores higher on a test no matter how much she sleeps.
C. In general, Aria scores lower on a test no matter how much she sleeps.
D. In general, Aria scores higher on a test when she sleeps more and scores lower on a test when she sleeps less.

Answers: 3


Other questions on the subject: Mathematics
Mathematics, 22.06.2019 00:00, Jasoncookies23
Awindow has the shape of a rectangle with a semi circle at the top. find the approximate area of the window using the dimensions shown. 4ft by 8ft
Answers: 1
Mathematics, 22.06.2019 01:30, reneebrown017
Use the given degree of confidence and sample data to construct a confidence interval for the population mean mu . assume that the population has a normal distribution. a laboratory tested twelve chicken eggs and found that the mean amount of cholesterol was 185 milligrams with sequals 17.6 milligrams. a confidence interval of 173.8 mgless than muless than 196.2 mg is constructed for the true mean cholesterol content of all such eggs. it was assumed that the population has a normal distribution. what confidence level does this interval represent?
Answers: 1
Do you know the correct answer?
The scatterplot shows the amount of sleep that Aria got the night before a test and her test scores....
Questions in other subjects:
Mathematics, 09.10.2019 20:00

History, 09.10.2019 20:00

Social Studies, 09.10.2019 20:00
Mathematics, 09.10.2019 20:00

Biology, 09.10.2019 20:00
History, 09.10.2019 20:00

English, 09.10.2019 20:00

Geography, 09.10.2019 20:00
History, 09.10.2019 20:00


