

Mathematics, 13.01.2021 05:40, ani61
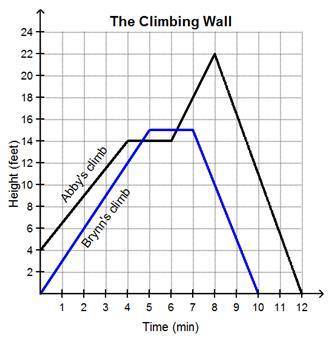
The graph represents the heights of two climbers on a climbing wall over a 12-minute time period.
A graph titled The Climbing Wall where the horizontal axis shows time (minutes), numbered 1 to 12, and the vertical axis shows height (feet) numbered 2 to 24. The line labeled Brynn's climb begins at 0 feet in 0 minutes, to 15 feet from 5 to 7 minutes, to 0 feet in 10 minutes. The line labeled Abby's climb begins at 4 feet in 0 minutes, to 14 feet from 4 to 6 minutes, to 22 feet in 8 minutes, to 0 feet in 12 minutes.
Which statement is true about the climbers’ heights?
Brynn was resting at a constant climbing height when Abby’s climbing height was decreasing.
Abby’s climbing height was decreasing when Brynn’s climbing height was increasing.
The heights of both climbers increased, then decreased, with no rest at a constant height.
Both climbers rested on the wall at a constant height for 2 minutes.

Answers: 3


Other questions on the subject: Mathematics
Mathematics, 21.06.2019 15:50, AaronMicrosoft15
If you shift the linear parent function, f(x)=x, up 13 units, what is the equation of the new function?
Answers: 1
Mathematics, 21.06.2019 21:30, jstringe424
This is a map of the mars exploration rover opportunity predicted landing site on mars. the scale is 1cm : 9.4km. what are the approximate measures of the actual length and width of the ellipse? i mostly need to know how to set it up : )
Answers: 3
Mathematics, 22.06.2019 03:10, hardwick744
Which statement is true about the discontinuities of the function f(x) = x-5/ 3x^2-17x-28
Answers: 2
Do you know the correct answer?
The graph represents the heights of two climbers on a climbing wall over a 12-minute time period.
A...
Questions in other subjects:
Mathematics, 23.08.2021 14:00


English, 23.08.2021 14:00
Mathematics, 23.08.2021 14:00
Physics, 23.08.2021 14:00

History, 23.08.2021 14:00

Business, 23.08.2021 14:00


