


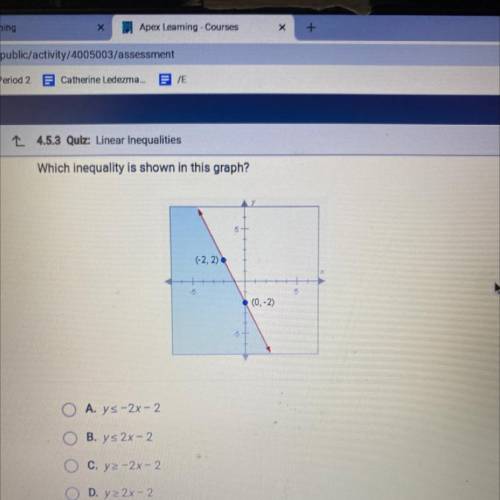
Which inequality is shown in this graph?
(-2, 2)
(0,-2)
O A. ys -2x - 2
O B. ys 2...

Mathematics, 11.01.2021 23:20, MrKrinkle77
Which inequality is shown in this graph?
(-2, 2)
(0,-2)
O A. ys -2x - 2
O B. ys 2x - 2
O C. yz -2x-2
O D. yz 2x-2

Answers: 1
Other questions on the subject: Mathematics
Mathematics, 21.06.2019 19:30, sindy35111
Solve the equation for x.3(6x - 1) = 12 i've tried doing the math and i can't find out what i'm doing wrong
Answers: 1
Mathematics, 21.06.2019 22:10, BilliePaul95
Ellen makes and sells bookmarks. she graphs the number of bookmarks sold compared to the total money earned. why is the rate of change for the function graphed to the left?
Answers: 1
Do you know the correct answer?
Questions in other subjects:
Mathematics, 07.09.2020 03:01


Mathematics, 07.09.2020 03:01


