Mathematics, 11.01.2021 22:00, OGxSniperGodx
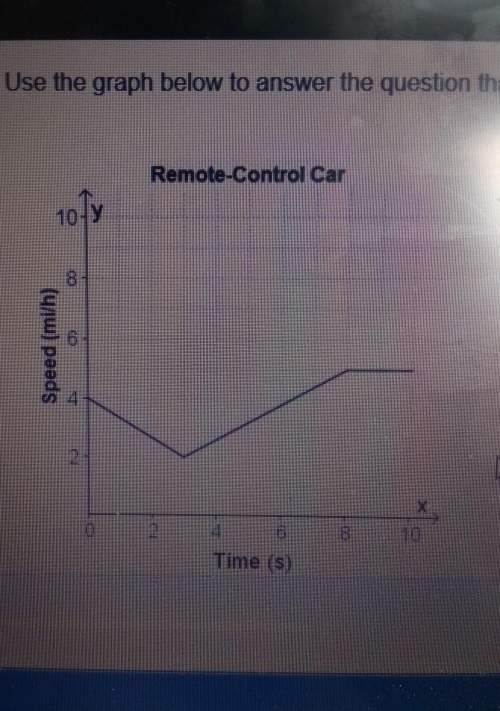
The graph shows the temperature at different heights inside a stadium.
Temperature at Different
Stadium Heights
Temperature (°F)
100
95
90
85
80
75+
70
65
60
55
50
0
5 10 15 20 25 30 35 40 45 50
Stadium Height (ft)
Which statement describes the trend in the graph?
O A. As the height increases, the temperature decreases.
B. As the height increases, the temperature increases.
C. As the height increases, the temperature stays the same.
O D. As the height decreases, the temperature increases.
O E. As the height decreases, the temperature stays the same.

Answers: 1
Other questions on the subject: Mathematics

Mathematics, 21.06.2019 16:10, bananaslada
Determine whether the following statements are true and give an explanation or counterexample. bold a. when using the shell method, the axis of the cylindrical shells is parallel to the axis of revolution. bold b. if a region is revolved about the y-axis, then the shell method must be used. bold c. if a region is revolved about the x-axis, then in principle it is possible to use the disk/washer method and integrate with respect to x or the shell method and integrate with respect to y.
Answers: 3

Mathematics, 21.06.2019 19:00, mcccreamullinsr
How can you tell when x and y are not directly proportional?
Answers: 1


Mathematics, 21.06.2019 23:30, liaholmes8
Walking at a constant rate of 8 kilometers per hour, juan can cross a bridge in 6 minutes. what is the length of the bridge in meters?
Answers: 1
Do you know the correct answer?
The graph shows the temperature at different heights inside a stadium.
Temperature at Different
Questions in other subjects:


Mathematics, 14.07.2019 11:00

History, 14.07.2019 11:00

Mathematics, 14.07.2019 11:00


Biology, 14.07.2019 11:00


