

Mathematics, 10.01.2021 09:00, jack104365
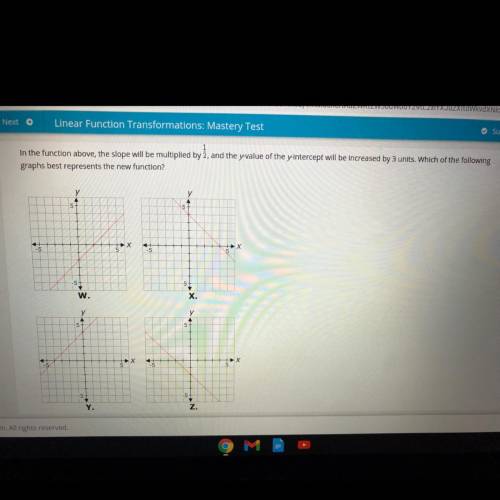
Pls help me I’m crying In the function above, the slope will be multiplied by 2, and the yvalue of the yIntercept will be increased by 3 units. Which of the following
graphs best represents the new function?
у
у
5
5
A
Х
X
5
-5+
-5+
W.
X.
у
4
5
5
х
X
5
5
5
-5
Y.
N

Answers: 3


Other questions on the subject: Mathematics
Mathematics, 21.06.2019 17:30, sarinawhitaker
25 ! the line of best fit is h = 5a + 86. predict the height at age 16. show your work.
Answers: 1
Mathematics, 21.06.2019 23:10, ammarsico19
Tom travels between the two mile markers shown and then finds his average speed in miles per hour. select the three equations that represent this situation.
Answers: 1
Mathematics, 22.06.2019 03:00, Samanthas6365
12 3 4 5 6 7 8 9 10 time remaining 42: 01 ryan gathered data about the age of the different dogs in his neighborhood and the length of their tails. which best describes the strength of the correlation, and what is true about the causation between the variables?
Answers: 2
Do you know the correct answer?
Pls help me I’m crying In the function above, the slope will be multiplied by 2, and the yvalue of t...
Questions in other subjects:


Spanish, 15.04.2020 21:50


History, 15.04.2020 21:50

English, 15.04.2020 21:50
Mathematics, 15.04.2020 21:50


