

Mathematics, 09.01.2021 01:00, carlosluiscontrerasp
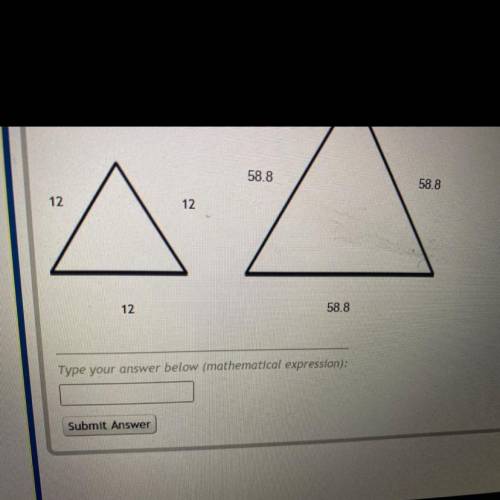
The two equilateral triangles below are similar figures. What is the scale factor from the small triangle on the left to the large triangle on the right? The triangles are not drawn to scale.

Answers: 1


Other questions on the subject: Mathematics
Mathematics, 21.06.2019 17:00, TheRunningPotatoe245
Asif spent $745.10 on 13 new file cabinets for his office. small file cabinets cost $43.50 and large file cabinets cost $65.95. write and solve a system of equations to find the number of small cabinets and large cabinets he purchased. determine if each statement is true or false. 1. he purchased 5 small cabinets. true or false 2. he purchased 7 large cabinets. true or false 3. he spent $527.60 on large cabinets. true or false
Answers: 2
Mathematics, 21.06.2019 18:00, officialgraciela67
Which shows the correct lengths of side c in both scales? scale 1: 45 m; scale 2: 60 m scale 1: 60 m; scale 2: 45 m scale 1: 36 m; scale 2: 27 m scale 1: 27 m; scale 2: 36 m mark this and return save and exit
Answers: 3
Mathematics, 21.06.2019 21:30, neptunesx
Students are given 3 minutes to complete each multiple-choice question on a test and 8 minutes for each free-responsequestion. there are 15 questions on the test and the students have been given 55 minutes to complete itwhich value could replace x in the table? 5507-m23-m8(15-m)8(15)-m
Answers: 2
Mathematics, 22.06.2019 02:00, mathhelppls14
1. the manager of collins import autos believes the number of cars sold in a day (q) depends on two factors: (1) the number of hours the dealership is open (h) and (2) the number of salespersons working that day (s). after collecting data for two months (53 days), the manager estimates the following log-linear model: q 4 equation 1 a. explain, how to transform the log-linear model into linear form that can be estimated using multiple regression analysis. the computer output for the multiple regression analysis is shown below: q4 table b. how do you interpret coefficients b and c? if the dealership increases the number of salespersons by 20%, what will be the percentage increase in daily sales? c. test the overall model for statistical significance at the 5% significance level. d. what percent of the total variation in daily auto sales is explained by this equation? what could you suggest to increase this percentage? e. test the intercept for statistical significance at the 5% level of significance. if h and s both equal 0, are sales expected to be 0? explain why or why not? f. test the estimated coefficient b for statistical significance. if the dealership decreases its hours of operation by 10%, what is the expected impact on daily sales?
Answers: 2
Do you know the correct answer?
The two equilateral triangles below are similar figures. What is the scale factor from the small tri...
Questions in other subjects:

Biology, 29.09.2021 22:20
Mathematics, 29.09.2021 22:20

History, 29.09.2021 22:20

Social Studies, 29.09.2021 22:20
Biology, 29.09.2021 22:20


