

Mathematics, 08.01.2021 04:30, lashayl27
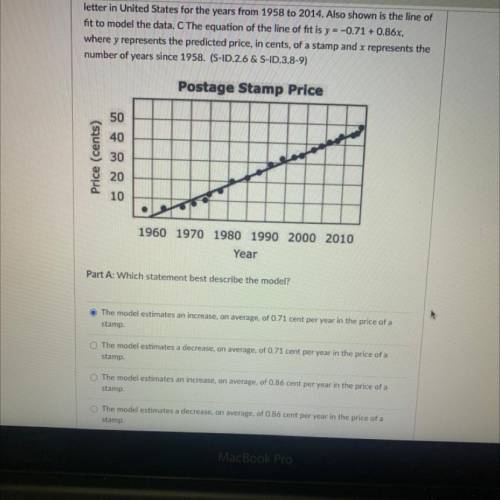
The scatter plot shows the price, in cents, of a postage stamp used to mail a letter in United States for the years from 1958 to 2014. Also shown is the line of fit to model the dataThe equation of the line of fit is y = - 0.71 + 0.86x , where represents the predicted price, in cents, of a stamp and x represents the number of years since 1958. (S& S-ID.3.8-9 )PLS HELP!!

Answers: 1


Other questions on the subject: Mathematics
Do you know the correct answer?
The scatter plot shows the price, in cents, of a postage stamp used to mail a letter in United State...
Questions in other subjects:

Computers and Technology, 22.09.2019 05:10


