

Mathematics, 08.01.2021 01:00, NeVaRkLoE
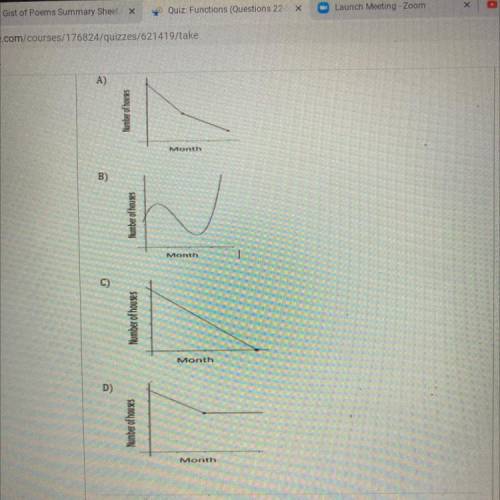
In Tampa the number of new houses built each month during the first
half of the year decreased at a constant rate. During the second half of
the year the number of new houses remained the same.
Which graph best illustrates the numbers of houses built over the
course of the year?
A)
Number of houses
Month

Answers: 2


Other questions on the subject: Mathematics
Mathematics, 21.06.2019 15:30, superstarsara5ouh83x
Write an equation of a line in slope intercept form that is perpendicular to the line 2x -3y = 12 and passes through the point (2, 6).
Answers: 3
Mathematics, 21.06.2019 19:00, laneake96
Hector and alex traded video games. alex gave hector one fourth of his video games in exchange for 6 video games. then he sold 3 video games and gave 2 video games to his brother. alex ended up with 16 video games. how many video games did alex have when he started?
Answers: 2
Mathematics, 21.06.2019 21:00, leannaadrian
2x minus y equals 6, x plus y equals negative 3
Answers: 1
Mathematics, 21.06.2019 21:10, zahradawkins2007
Identify the initial amount a and the growth factor b in the exponential function. a(x)=680*4.3^x
Answers: 2
Do you know the correct answer?
In Tampa the number of new houses built each month during the first
half of the year decreased at a...
Questions in other subjects:


Biology, 31.07.2019 09:30

Mathematics, 31.07.2019 09:30
Mathematics, 31.07.2019 09:30


Chemistry, 31.07.2019 09:30


