


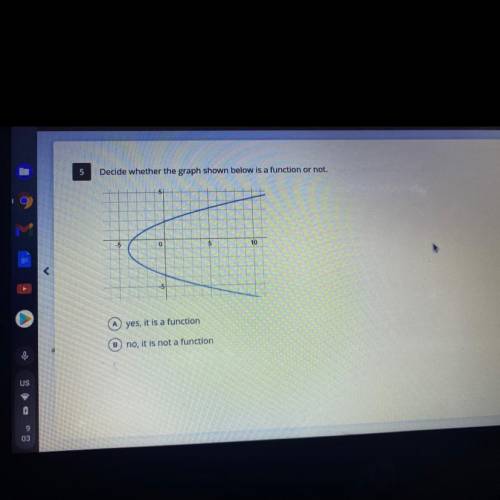
Decide whether the graph shown below is a function or not.
A) yes, its a function
B) No, it...

Mathematics, 07.01.2021 17:20, whitakers87
Decide whether the graph shown below is a function or not.
A) yes, its a function
B) No, it is not a function

Answers: 1
Other questions on the subject: Mathematics
Mathematics, 21.06.2019 19:30, spotty2093
Your food costs are $5,500. your total food sales are $11,000. what percent of your food sales do the food costs represent?
Answers: 2
Mathematics, 21.06.2019 19:30, kataldaine
Which of the following describes the symmetry of the graph of y = x3?
Answers: 2
Mathematics, 21.06.2019 21:00, hastephens03
Mr. thompson is on a diet. he currently weighs 260 pounds. he loses 4 pounds per month. what part of the story makes the relationship not proportional?
Answers: 3
Do you know the correct answer?
Questions in other subjects:


