

Mathematics, 07.01.2021 16:50, garcikyl000
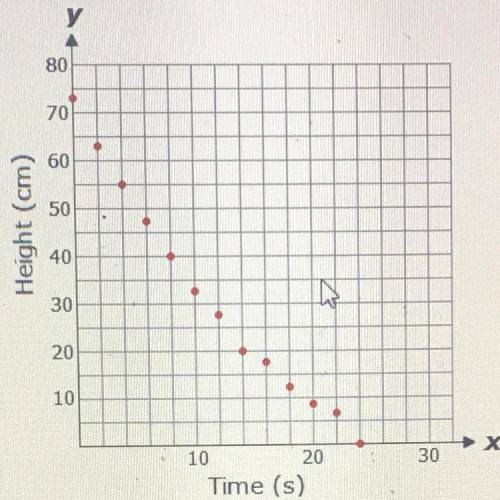
Kristin conducted an experiment in her science class to see how water drained from a contamer The given graph shows the data
that Kristin collected as a function of the height of the water over time
Krisin's two most accurately plotted points for the rate of flow of the water occurred when the height of the water was
fifty-five centimeters after four seconds and when the height was twenty centimeters after fourteen seconds
Use these two data points to determine the equation for the line of best fit for Krisin's experiment

Answers: 2


Other questions on the subject: Mathematics
Mathematics, 21.06.2019 19:00, yehnerthannah
Through non-collinear points there is exactly one plane.
Answers: 1
Mathematics, 21.06.2019 19:00, filthyfish
Teams of 4 are competing in a 1/4 mile relay race. each runner must run the same exact distance. what is the distance each teammate runs?
Answers: 1
Mathematics, 21.06.2019 19:30, kristofwr3444
Acar started driving from city a to city b, distance between which is 620 miles, at a rate of 60 mph. two hours later a truck left city b and started moving towards city a at a rate of 40 mph. how many hours after the truck's departure will the two meet?
Answers: 1
Do you know the correct answer?
Kristin conducted an experiment in her science class to see how water drained from a contamer The gi...
Questions in other subjects:


Social Studies, 03.02.2021 17:50
Mathematics, 03.02.2021 17:50
Mathematics, 03.02.2021 17:50
Mathematics, 03.02.2021 17:50
English, 03.02.2021 17:50


