

Mathematics, 07.01.2021 01:00, murarimenon
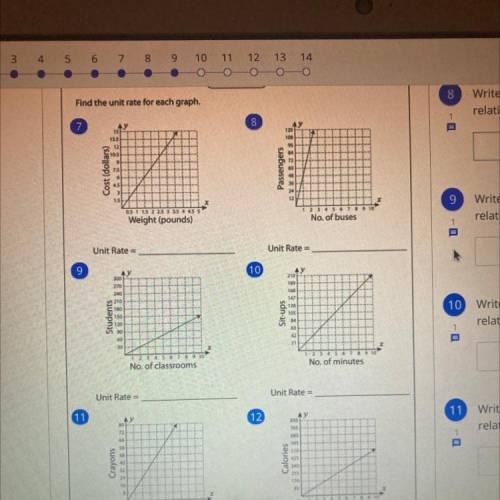
can someone pls help me understand how to find the equation to show the relationship between x and y for these? its only 6th grade math so it shouldnt be too hard

Answers: 2


Other questions on the subject: Mathematics
Mathematics, 21.06.2019 18:00, evarod
The given dot plot represents the average daily temperatures, in degrees fahrenheit, recorded in a town during the first 15 days of september. if the dot plot is converted to a box plot, the first quartile would be drawn at __ , and the third quartile would be drawn at link to the chart is here
Answers: 1
Mathematics, 21.06.2019 18:10, TrueMonster8911
What is the equation in slope-intercept form of the linear function represented by the table? y -18 -1 -8 4 2 912 o y=-2x-6 o y=-2x+6 o y=2x-6 o y = 2x+6
Answers: 1
Do you know the correct answer?
can someone pls help me understand how to find the equation to show the relationship between x and y...
Questions in other subjects:
Mathematics, 09.01.2021 01:00
Mathematics, 09.01.2021 01:00


Mathematics, 09.01.2021 01:00

Mathematics, 09.01.2021 01:00


