


PLEASE HELP :(
Shown below are the scatter plots for four different data sets.
Answer the que...

Mathematics, 07.01.2021 01:00, YeaIght
PLEASE HELP :(
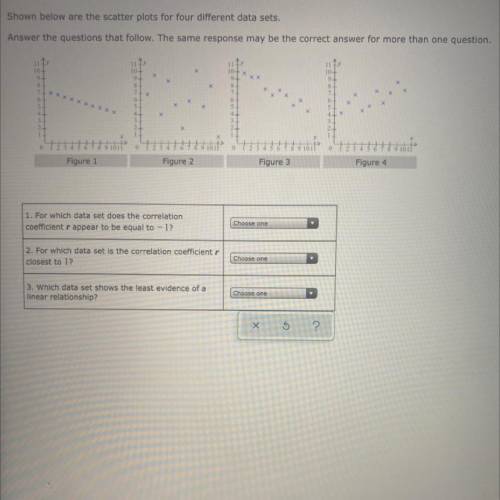
Shown below are the scatter plots for four different data sets.
Answer the questions that follow. The same response may be the correct answer for more than one question.
2-
Figure
Figure 2
Figure 3
Figure 4
1. For which data set does the correlation
coefficient r appear to be equal to-1?
Choose one
2. For which data set is the correlation coefficient
closest to 1?
Choose one
3. Which data set shows the least evidence of a
linear relationship?
Choosec one
X

Answers: 3
Other questions on the subject: Mathematics
Mathematics, 21.06.2019 19:30, tigistamare03
Acabinmaker buys 3.5 liters of oat varnish the varnish cost $4.95 per liter what is the total cost of 3.5 liters
Answers: 1
Mathematics, 21.06.2019 19:40, payshencec21
Which of the following three dimensional figures has a circle as it’s base
Answers: 2
Do you know the correct answer?
Questions in other subjects:
Mathematics, 06.12.2021 04:00

Mathematics, 06.12.2021 04:00


Health, 06.12.2021 04:00
Health, 06.12.2021 04:00


