

Mathematics, 06.01.2021 01:50, eduardoma2902
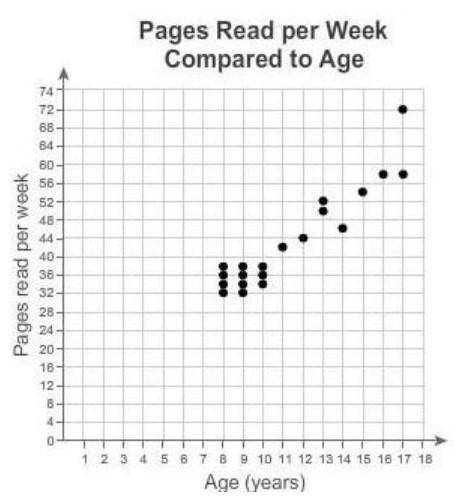
The scatter plot shows the relationship between pages read per week and age. What is the range of the cluster shown in the scatter plot?
A) 8 to 10 years of age
B) 8 to 17 years of age
C) 32 to 39 pages read per week
D) 32 to 72 pages read per week
part 2:
The scatter plot shows the relationship between pages read per week and age. What is the domain of the cluster shown in the scatter plot?
A) 8 to 10 years of age
B) 8 to 17 years of age
C) 32 to 39 pages read per week
D) 32 to 72 pages read per week

Answers: 2


Other questions on the subject: Mathematics
Mathematics, 21.06.2019 18:50, xlebrny1215
Which translation maps the vertex of the graph of the function f(x) = x2 onto the vertex of the function g(x) = x2 – 10x +2?
Answers: 1
Mathematics, 21.06.2019 20:30, janwesley3
Select all expressions that are equivalent to 2(3x + 7y). question 1 options: 6x + 14y 6x + 7y 1(6x + 14y)
Answers: 1
Mathematics, 21.06.2019 23:00, soldierboy771
What is the length of the midsegment of a trapezoid with bases of length 15 and 25 ?
Answers: 1
Mathematics, 22.06.2019 01:30, hayleegahr
Which term describes the point where the perpendicular bisectors of the three sides of a triangle intersect?
Answers: 3
Do you know the correct answer?
The scatter plot shows the relationship between pages read per week and age. What is the range of th...
Questions in other subjects:


History, 24.07.2019 02:00

Social Studies, 24.07.2019 02:00
Social Studies, 24.07.2019 02:00


