Mathematics, 04.01.2021 20:40, selenamoreno8713
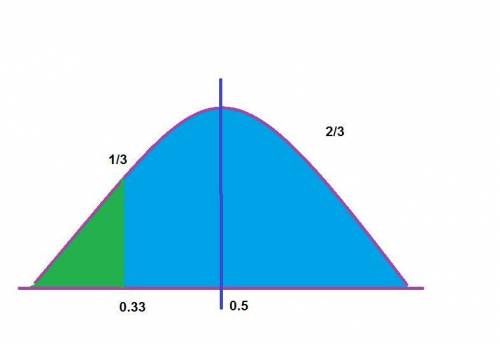
Suppose over several years of offering AP Statistics, a high school finds that final exam scores are normally distributed with a mean of 78 and a standard deviation of 6.a. What are the mean, standard deviation, and shape of the distribution of x-bar for n = 50?b. What’s the probability a sample of scores will have a mean greater than 80?c. Sketch the distribution curve for part B, showing the area that represents the probability you found.

Answers: 1
Other questions on the subject: Mathematics

Mathematics, 21.06.2019 12:50, shelbylynn17
Given this information, which expression must represent the value of b?
Answers: 1


Mathematics, 21.06.2019 21:30, alegora78
He ! a group of farmers planned to clean 80 acres of wheat per day to finish the work on schedule. right before the work started, they received a new piece of machinery that them clean 10 more acres per day than originally planned. as a result of increased productivity in the last day before the deadline they only had to clean 30 acres. how many acres of wheat did the group of farmers have to clean?
Answers: 1
Do you know the correct answer?
Suppose over several years of offering AP Statistics, a high school finds that final exam scores are...
Questions in other subjects:


History, 03.03.2020 05:06


