

Mathematics, 04.01.2021 06:30, hargunk329
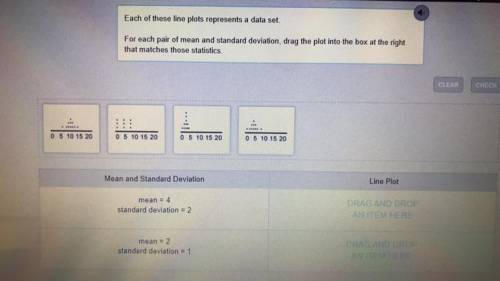
Each of these line plots represents a data set
For each pair of mean and standard deviation, drag the plot into the box at the right
that matches those statistics

Answers: 1


Other questions on the subject: Mathematics
Mathematics, 21.06.2019 17:00, a897coleman
One month, a music site observed that 60% of the people who downloaded songs from its site downloaded q sam's latest single. the equation below represents this information, where x represents the total number of people who ddownloaded songs from the site that month: x = 0.6x + 384 how many people who downloaded songs from the site that month downloaded q sam's latest single?
Answers: 3
Mathematics, 21.06.2019 17:30, laurielaparr2930
X-intercept=-5 y-intercept=2 the equation of the line is
Answers: 2
Mathematics, 21.06.2019 20:20, redbeast677
The polynomial 10x3 + 35x2 - 4x - 14 is factored by grouping. 10x3 + 35x2 - 4x - 14 5x )-20 what is the common factor that is missing from both sets of parentheses?
Answers: 2
Do you know the correct answer?
Each of these line plots represents a data set
For each pair of mean and standard deviation, drag t...
Questions in other subjects:


Spanish, 02.07.2019 02:00
Mathematics, 02.07.2019 02:00

History, 02.07.2019 02:00
Mathematics, 02.07.2019 02:00


