

Mathematics, 04.01.2021 04:20, pinsonjon1129
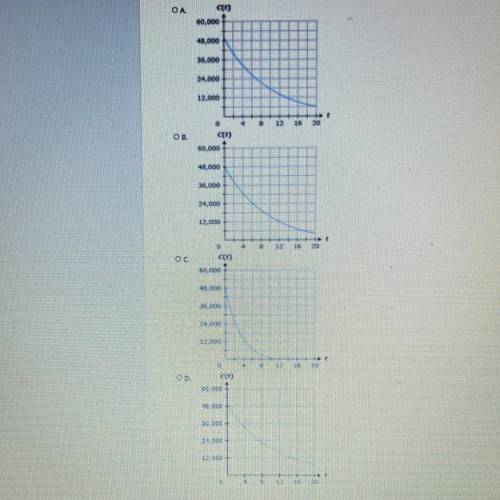
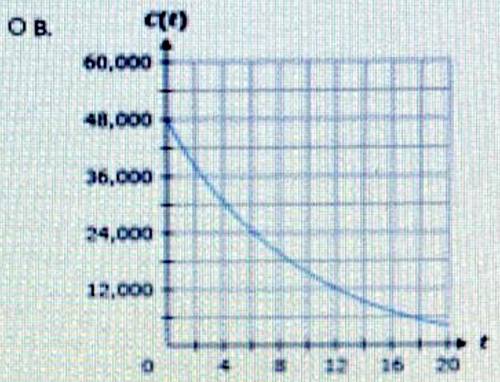
The value of a car, C(t), t years after 2011, is modeled by the following function.
C(t) = 50,000(0.9)^t - 2,000
Which graph represents this function?

Answers: 3


Other questions on the subject: Mathematics
Mathematics, 21.06.2019 17:40, PONBallfordM89
How can the correlation in the scatter plot graph below best be described? positive correlation negative correlation both positive and negative no correlation
Answers: 1
Mathematics, 21.06.2019 18:30, zovav1oszg9z
Analyze the graph of the cube root function shown on the right to determine the transformations of the parent function. then, determine the values of a, h, and k in the general equation.
Answers: 1
Do you know the correct answer?
The value of a car, C(t), t years after 2011, is modeled by the following function.
C(t) = 50,000(0...
Questions in other subjects:
Mathematics, 12.04.2021 18:50

Mathematics, 12.04.2021 18:50

Mathematics, 12.04.2021 18:50

English, 12.04.2021 18:50
Mathematics, 12.04.2021 18:50


