

Mathematics, 03.01.2021 08:40, germainenez3288
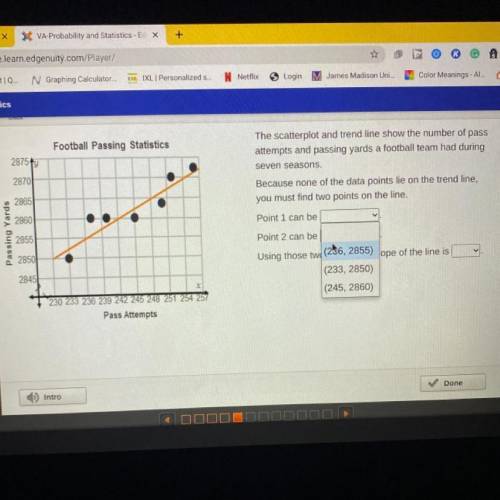
The scatterplot and trend line show the number of pass
attempts and passing yards a football team had during
seven seasons.
Because none of the data points lie on the trend line,
you must find two points on the line.
Point 1 can be
Point 2 can be
Using those twe (26, 2855) ope of theline is|
Football Passing Statistics
2875fy
2870
2865
2860
E2855
2850
2845
(233,2850)
(245, 2860)
230 233 238 239 242 245 248 251 254257
Pass Attempts
Done

Answers: 3


Other questions on the subject: Mathematics
Mathematics, 21.06.2019 18:30, waldruphope3956
Can someone check if i did this right since i really want to make sure it’s correct. if you do you so much
Answers: 2
Mathematics, 21.06.2019 20:40, kaylabethany
How is the equation of this circle written in standard form? x2 + y2 - 6x + 14y = 142 a) (x - 3)2 + (y + 7)2 = 200 b) (x+ 3)2 + (y - 7)2 = 200 (x - 6)2 + (y + 14)2 = 142 d) (x+6)2 + (y- 14)2 = 142
Answers: 1
Mathematics, 21.06.2019 21:30, oliup567
(c) the diagram shows the first three shapes of a matchsticks arrangement. first shape = 3second shape = 5third shape = 7given m represents the number of matchstick used to arrange the n'th shape.(i) write a formula to represent the relation between m and n. express m as the subjectof the formula.(ii) 19 matchsticks are used to make the p'th shape. find the value of p.
Answers: 2
Do you know the correct answer?
The scatterplot and trend line show the number of pass
attempts and passing yards a football team h...
Questions in other subjects:

Health, 26.09.2019 21:30

Spanish, 26.09.2019 21:30

Mathematics, 26.09.2019 21:30
Mathematics, 26.09.2019 21:30

Mathematics, 26.09.2019 21:30

History, 26.09.2019 21:30
Mathematics, 26.09.2019 21:30


