

Mathematics, 01.01.2021 22:30, mateotrevino1
I REALLY NEED HELP!!
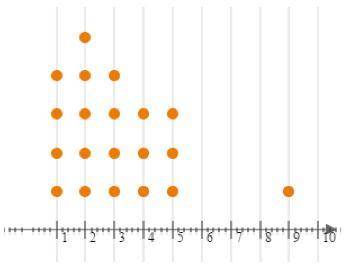
The data for numbers of times per week 20 students at Stackamole High eat vegetables are shown below:
Part A: Describe the dot plot.
Part B: What, if any, are the outliers in these data? Show your work.
Part C: What is the best measure of center for these data? Explain your reasoning.

Answers: 1


Other questions on the subject: Mathematics
Mathematics, 21.06.2019 19:30, youcandoit13
Click the arrows to advance or review slides. mapping carbohydrates to food carbohydrates (grams) 15 food (quantity) bread (1 slice) pasta (1/3 cup) apple (1 medium) mashed potatoes (1/2 cup) broccoli (1/2 cup) carrots (1/2 cup) milk (1 cup) yogurt (6 oz.) 12 12 is jennifer's relation a function? yes no f 1 of 2 → jennifer figure out the difference between a function and a relation by answering the questions about her food choices
Answers: 2
Mathematics, 21.06.2019 20:30, alexialiles19
Max recorded the heights of 500 male humans. he found that the heights were normally distributed around a mean of 177 centimeters. which statements about max’s data must be true? a) the median of max’s data is 250 b) more than half of the data points max recorded were 177 centimeters. c) a data point chosen at random is as likely to be above the mean as it is to be below the mean. d) every height within three standard deviations of the mean is equally likely to be chosen if a data point is selected at random.
Answers: 2
Mathematics, 21.06.2019 21:30, stressedmolly8387
An annual marathon covers a route that has a distance of approximately 26 miles. winning times for this marathon are all over 2 hours. the following data are the minutes over 2 hours for the winning male runners over two periods of 20 years each. earlier period 14 12 15 22 13 10 19 13 9 14 20 18 16 20 23 12 18 17 6 13 recent period 7 11 7 14 8 9 11 14 8 7 9 8 7 9 9 9 9 8 10 8 (a) make a stem-and-leaf display for the minutes over 2 hours of the winning times for the earlier period. use two lines per stem. (use the tens digit as the stem and the ones digit as the leaf. enter none in any unused answer blanks. for more details, view how to split a stem.) minutes beyond 2 hours earlier period 0 1 2 (b) make a stem-and-leaf display for the minutes over 2 hours of the winning times for the recent period. use two lines per stem. (use the tens digit as the stem and the ones digit as the leaf. enter none in any unused answer blanks.) minutes beyond 2 hours recent period (c) compare the two distributions. how many times under 15 minutes are in each distribution
Answers: 2
Do you know the correct answer?
I REALLY NEED HELP!!
The data for numbers of times per week 20 students at Stackamole High eat vege...
Questions in other subjects:
Mathematics, 09.09.2021 07:10
Mathematics, 09.09.2021 07:10
Mathematics, 09.09.2021 07:10

Mathematics, 09.09.2021 07:10

Spanish, 09.09.2021 07:10


Advanced Placement (AP), 09.09.2021 07:10


