Mathematics, 31.12.2020 06:50, braydenaddison738
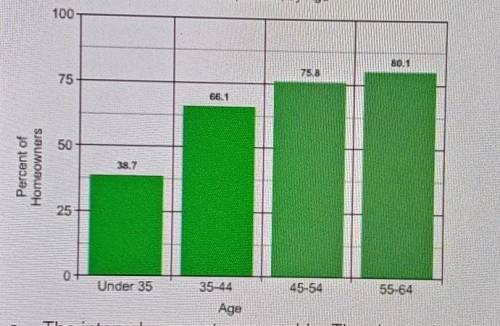
Use the graph below. Explain why the intervals on the horizontal axis could make the graph misleading
45.54
a. The intervals are not comparable. The shorter bar spans more than 10 years
b. The intervals are appropriately labeled
c. The intervals are not comparable, but the data on the graph is not misleading
d. The vertical axis does not have an appropriate scale


Answers: 3
Other questions on the subject: Mathematics

Mathematics, 21.06.2019 14:20, glocurlsprinces
At his new job, jeremiah can choose an hourly rate of $9 plus a $50 weekly bonus for opening the store, or an hourly rate of $10 per hour with no opening bonus. the equations model his salary options. y = 9x + 50 y = 10x
Answers: 2

Mathematics, 21.06.2019 17:50, beard6488
Adriana sold 50 shares of a company’s stock through a broker. the price per share on that day was $22.98. the broker charged her a 0.75% commission. what was adriana’s real return after deducting the broker’s commission? a. $8.62 b. $229.80 c. $1,140.38 d. $1,149.00
Answers: 1

Mathematics, 21.06.2019 20:30, elyzeraganitowlkn9
What is the radius of a circle with an area of 78.5 cubic inches? use 3.14 for pie
Answers: 2
Do you know the correct answer?
Use the graph below. Explain why the intervals on the horizontal axis could make the graph misleadin...
Questions in other subjects:

Mathematics, 28.06.2019 04:20


History, 28.06.2019 04:20


Social Studies, 28.06.2019 04:20

Mathematics, 28.06.2019 04:20


