


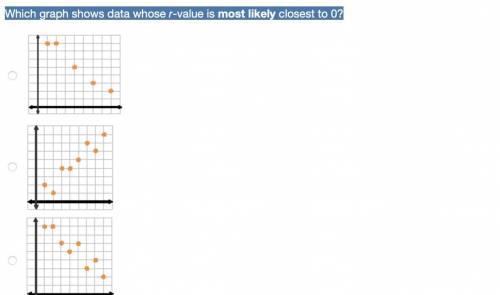
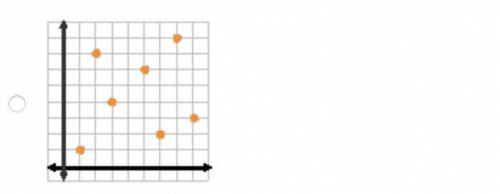
Which graph shows data whose r-value is most likely closest to 0?
...

Mathematics, 28.12.2020 02:20, kimhayleeshook50
Which graph shows data whose r-value is most likely closest to 0?

Answers: 2
Other questions on the subject: Mathematics
Mathematics, 21.06.2019 14:00, joemoe15jr
Two sides of a triangle mesure 20cm and 30cm. what is the measure of the third side
Answers: 3
Mathematics, 21.06.2019 16:00, evanwall91
If there is no real number solution to the quadratic equation x^2+2x+c=0 what is a possible value of c? 1 -2 0 3
Answers: 2
Mathematics, 21.06.2019 18:30, Alexandragurule18
Can someone check if i did this correct. it’s number 4 if you’re wondering.
Answers: 1
Mathematics, 21.06.2019 19:00, jrsecession
Use the formulas a = x 2 – y 2, b = 2xy, c = x 2 + y 2 to answer this question. one leg of a right triangle has length 11 and all sides are whole numbers. find the lengths of the other two sides. the other leg = a0 and the hypotenuse = a1
Answers: 2
Do you know the correct answer?
Questions in other subjects:


Chemistry, 16.09.2021 14:00

English, 16.09.2021 14:00
English, 16.09.2021 14:00
Mathematics, 16.09.2021 14:00
English, 16.09.2021 14:00

Computers and Technology, 16.09.2021 14:00


