

Mathematics, 27.12.2020 16:30, Fahaddie
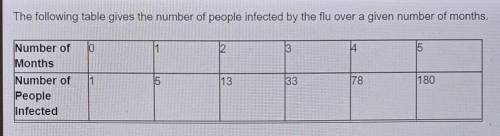
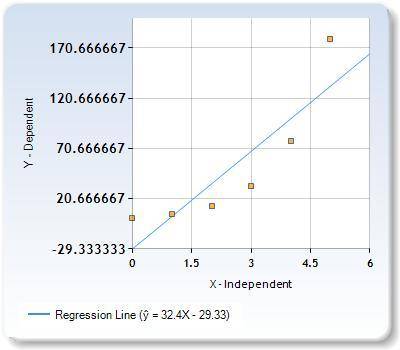
The following table gives the number of people infected by the flu over a given number of months.
Describe any trends or patterns that you observe.
a. The number of people infected is decreasing at a steady rate.
b. The number of months is increasing quickly. c. The number of people infected is increasing at a very fast rate.
d. There is no apparent trend or pattern in the table.

Answers: 2


Other questions on the subject: Mathematics
Mathematics, 21.06.2019 13:30, Tcrismon1000
Which best describes the transformation that occurs in the graph? a) dilation b) reflection c) rotation d) translation
Answers: 2
Mathematics, 21.06.2019 20:30, elijah4723
1) you deposit $2,500 in an account that earns 4% simple interest. how much do you earn in eight years?
Answers: 1
Do you know the correct answer?
The following table gives the number of people infected by the flu over a given number of months.
D...
Questions in other subjects:

English, 12.04.2021 16:30

Biology, 12.04.2021 16:30
Mathematics, 12.04.2021 16:30

History, 12.04.2021 16:30
History, 12.04.2021 16:30


