


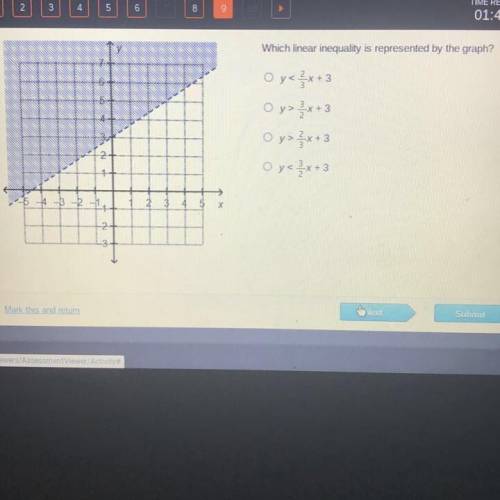
Please hurry ! ! which linear inequality is represented by the graph?
...

Mathematics, 25.12.2020 07:50, joeylozier15
Please hurry ! ! which linear inequality is represented by the graph?

Answers: 3
Other questions on the subject: Mathematics
Mathematics, 21.06.2019 12:30, 1hannacarson
Muscles, a membership-only gym is hoping to open a new branch in a small city in pennsylvania that currently has no fitness centers. according to their research approximately 12,600 residents live within driving distance of the gym. muscles sends out surveys to a sample of 300 randomly selected residents in this area (all of who respond) and finds that 40 residents say they would visit a gym if one was located in their area. based on the past survey research, muscles estimates that approximately 30% of these respondents would actually join the gym if they opened one in the area. based on this information and the results of the sample survey, about how many residents should muscles expect to join its new branch? a) 134 b) 504 c) 1,680 d) 3,780
Answers: 1
Mathematics, 21.06.2019 17:10, payshencec21
The number of chocolate chips in an 18-ounce bag of chocolate chip cookies is approximately normally distributed with a mean of 1252 chips and standard deviation 129 chips. (a) what is the probability that a randomly selected bag contains between 1100 and 1500 chocolate chips, inclusive? (b) what is the probability that a randomly selected bag contains fewer than 1125 chocolate chips? (c) what proportion of bags contains more than 1225 chocolate chips? (d) what is the percentile rank of a bag that contains 1425 chocolate chips?
Answers: 1
Mathematics, 21.06.2019 17:30, theeflyguy5
Student price tickets to a movie are $1 and non student tickets are $2 . 350 tickets are sold and the total amount made is $450. there were 250 student tickets sold . true or false .
Answers: 1
Mathematics, 21.06.2019 18:00, stephanielynch
Last year, a state university received 3,560 applications from boys. of those applications, 35 percent were from boys who lived in other states. part a)how many applications did the university receive from boys who lived in other states? part b)applications to the university from boys represented 40percent of all applications. how many applications did the university receive in all? i don't how to do part b so me and plz tell how you got your answer
Answers: 1
Do you know the correct answer?
Questions in other subjects:

English, 05.01.2021 07:40
Mathematics, 05.01.2021 07:40
Mathematics, 05.01.2021 07:40
Mathematics, 05.01.2021 07:40

Physics, 05.01.2021 07:40
Mathematics, 05.01.2021 07:40

History, 05.01.2021 07:40
History, 05.01.2021 07:40


