


Does this graph show a function? Explain how you know.
5
-5
5
-6
A. Yes; th...

Mathematics, 22.12.2020 21:30, makennaskye8052
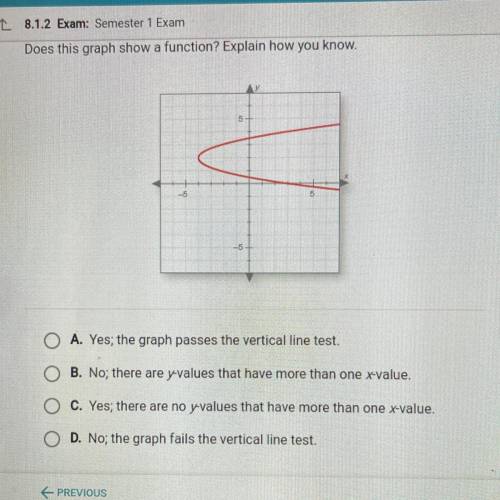
Does this graph show a function? Explain how you know.
5
-5
5
-6
A. Yes; the graph passes the vertical line test.
B. No; there are y-values that have more than one x-value.
C. Yes, there are no y values that have more than one x-value.
D. No; the graph fails the vertical line test.

Answers: 1
Other questions on the subject: Mathematics
Mathematics, 21.06.2019 14:00, heatherswiffin666
Rewrite the following without an exponent. (5/8)-1
Answers: 1
Mathematics, 21.06.2019 19:00, alyo31500
Graph g(x)=2cosx . use 3.14 for π . use the sine tool to graph the function. graph the function by plotting two points. the first point must be on the midline and closest to the origin. the second point must be a maximum or minimum value on the graph closest to the first point.
Answers: 1
Do you know the correct answer?
Questions in other subjects:
Mathematics, 04.02.2021 01:00


Mathematics, 04.02.2021 01:00
Mathematics, 04.02.2021 01:00


Business, 04.02.2021 01:00


