

Mathematics, 20.12.2020 18:00, shonherron
Which graph shows data whose r-value is most likely closest to 0?
A graph shows both axes unnumbered. Points show a downward trend.
A graph shows both axes unnumbered. Points show an upward trend.
A graph shows both axes unnumbered. Points show a downward trend.
A graph shows both axes unnumbered. Points are scattered all over the graph.

Answers: 1


Other questions on the subject: Mathematics
Mathematics, 21.06.2019 16:30, SkyeShadow525
The length of the largest fish is 967.74 times greater than the length of the smallest fish. select a variable expression that shows the length of the largest fish, if 8 is the length of the smallest fish. a. s + 967.74 b. \[ \frac{967.74}{s} \] c. 967.74 - s d. 967. 74s
Answers: 1
Mathematics, 22.06.2019 00:00, chaseking120418
If (x + 8) is a factor of f(x), which of the following must be true? both x = –8 and x = 8 are roots of f(x). neither x = –8 nor x = 8 is a root of f(x). f(–8) = 0 f(8) = 0
Answers: 3
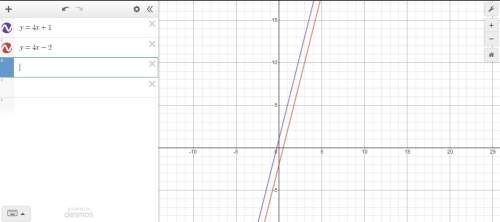
Mathematics, 22.06.2019 04:10, TombRaider167
Which statement describes the slope of the line?
Answers: 1
Do you know the correct answer?
Which graph shows data whose r-value is most likely closest to 0?
A graph shows both axes unnumbere...
Questions in other subjects:

History, 18.01.2020 01:31


Spanish, 18.01.2020 01:31
Mathematics, 18.01.2020 01:31


