

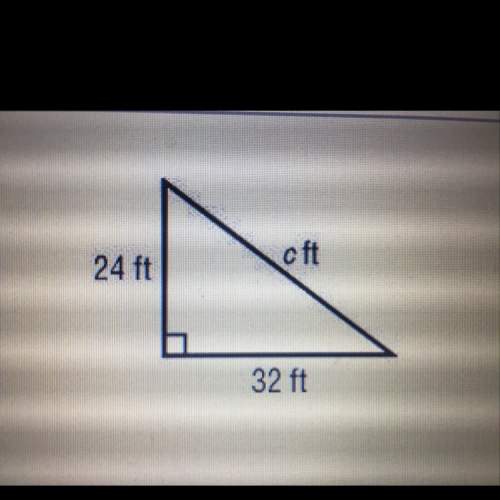
Mathematics, 18.12.2020 04:40, nell44
The cost of manufactured goods is rising at the rate of inflation, or at about 3.4%. Suppose
an item costs $18 today. How much will it cost seven years from now due to inflation?
Round the answer to the hundredth.

Answers: 3


Other questions on the subject: Mathematics
Mathematics, 21.06.2019 16:00, kell22wolf
Part one: measurements 1. measure your own height and arm span (from finger-tip to finger-tip) in inches. you will likely need some from a parent, guardian, or sibling to get accurate measurements. record your measurements on the "data record" document. use the "data record" to you complete part two of this project. name relationship to student x height in inches y arm span in inches archie dad 72 72 ginelle mom 65 66 sarah sister 64 65 meleah sister 66 3/4 67 rachel sister 53 1/2 53 emily auntie 66 1/2 66 hannah myself 66 1/2 69 part two: representation of data with plots 1. using graphing software of your choice, create a scatter plot of your data. predict the line of best fit, and sketch it on your graph. part three: the line of best fit include your scatter plot and the answers to the following questions in your word processing document 1. 1. which variable did you plot on the x-axis, and which variable did you plot on the y-axis? explain why you assigned the variables in that way. 2. write the equation of the line of best fit using the slope-intercept formula $y = mx + b$. show all your work, including the points used to determine the slope and how the equation was determined. 3. what does the slope of the line represent within the context of your graph? what does the y-intercept represent? 5. use the line of best fit to you to describe the data correlation.
Answers: 2
Mathematics, 21.06.2019 17:20, organicmemez
Researchers were interested in whether relaxation training decreases the number of headaches a person experiences. they randomly assigned 20 participants to a control group or a relaxation training group and noted the change in number of headaches each group reported from the week before training to the week after training. which statistical analysis should be performed to answer the researchers' question?
Answers: 2
Mathematics, 21.06.2019 18:10, heavenwagner
which of the following sets of data would produce the largest value for an independent-measures t statistic? the two sample means are 10 and 20 with variances of 20 and 25 the two sample means are 10 and 20 with variances of 120 and 125 the two sample means are 10 and 12 with sample variances of 20 and 25 the two sample means are 10 and 12 with variances of 120 and 125
Answers: 2
Mathematics, 21.06.2019 19:00, ktenz
Asmall business produces and sells balls. the fixed costs are $20 and each ball costs $4.32 to produce. each ball sells for $8.32. write the equations for the total cost, c, and the revenue, r, then use the graphing method to determine how many balls must be sold to break even.
Answers: 3
Do you know the correct answer?
The cost of manufactured goods is rising at the rate of inflation, or at about 3.4%. Suppose
an ite...
Questions in other subjects:

World Languages, 07.10.2021 19:10


Computers and Technology, 07.10.2021 19:10

Physics, 07.10.2021 19:10

Social Studies, 07.10.2021 19:10
Social Studies, 07.10.2021 19:10

Mathematics, 07.10.2021 19:10


