


Opal walked from school to home, which
was a distance of 12 miles. She walked
at a rate of 4...

Mathematics, 17.12.2020 22:40, 2002babygurl
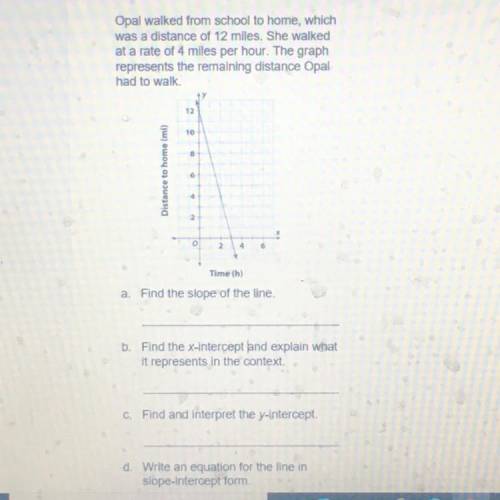
Opal walked from school to home, which
was a distance of 12 miles. She walked
at a rate of 4 miles per hour. The graph
represents the remaining distance Opal
had to walk
12
10
home (mi)
8
Distance
Time (h)
a. Find the slope of the line.
b. Find the x-intercept and explain what
it represents in the context.
C. Find and Interpret the y-intercept.

Answers: 1
Other questions on the subject: Mathematics
Mathematics, 21.06.2019 23:10, kleighlamb4850
Which best describes the function on the graph? direct variation; k = −2 direct variation; k = -1/2 inverse variation; k = −2 inverse variation; k = -1/2
Answers: 2
Mathematics, 22.06.2019 02:40, Ghhkgu5120
If /is a line of symmetry, plot the partner points for the ones shown. noch 6 5 4 -3 -2 -1
Answers: 1
Mathematics, 22.06.2019 04:30, alexisss23
Television viewing reached a new high when the global information and measurement company reported a mean daily viewing time of 8.35 hours per household. use a normal probability distribution with a standard deviation of 2.5 hours to answer the following questions about daily television viewing per household. a. what is the probability that a household views television between 4 and 10 hours a day? (to 4 decimals) b. how many hours of television viewing must a household have in order to be in the top 7% of all television viewing household? (to 2 decimals) c. what is the probability that a household views television more than 4 hours a day? (to 4 decimals)
Answers: 1
Do you know the correct answer?
Questions in other subjects:

Computers and Technology, 18.03.2021 01:20


Mathematics, 18.03.2021 01:20
Mathematics, 18.03.2021 01:20

Mathematics, 18.03.2021 01:20


