

Mathematics, 17.12.2020 20:00, raconteuraki
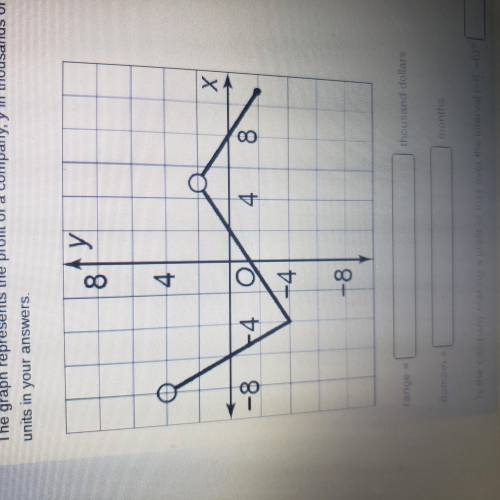
The graph represents the profit of a company, y in thousands of dollars, in time, x in months, before and after it changed management. Include units in your answers.
Range: _ thousand dollars
Domain: _ months
Is the company making a profit or loss over the interval (-8,-6)? _

Answers: 3


Other questions on the subject: Mathematics
Mathematics, 21.06.2019 21:10, samtrevino9921
Which exponential function has an initial value of 2? f(x) = 2(3x) f(x) = 3(2x)
Answers: 1
Do you know the correct answer?
The graph represents the profit of a company, y in thousands of dollars, in time, x in months, befor...
Questions in other subjects:


History, 16.11.2019 06:31
Mathematics, 16.11.2019 06:31


