

Mathematics, 17.12.2020 16:30, silverns
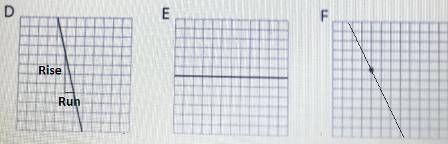
1. Calculate the slope of Graph D. Explain or show your reasoning
2. Calculate the slope of Graph E. What situation could the graph represent
3. On the blank grid , draw a line that passes through the indicated point and has the slope -2.


Answers: 2


Other questions on the subject: Mathematics
Mathematics, 21.06.2019 15:00, rebelprincezz5785
Asmall foreign car gete 42 miles per gallon and user 35 gallons on a trip. gasoline costs $1.05 per gallon. what was the cost of gasoline per mile driver?
Answers: 3
Mathematics, 21.06.2019 21:30, amesha62
In a test for esp (extrasensory perception), a subject is told that cards only the experimenter can see contain either a star, a circle, a wave, or a square. as the experimenter looks at each of 20 cards in turn, the subject names the shape on the card. a subject who is just guessing has probability 0.25 of guessing correctly on each card. a. the count of correct guesses in 20 cards has a binomial distribution. what are n and p? b. what is the mean number of correct guesses in 20 cards for subjects who are just guessing? c. what is the probability of exactly 5 correct guesses in 20 cards if a subject is just guessing?
Answers: 1
Mathematics, 21.06.2019 23:00, Hakika
In january 2010, you began a one-year study of tuberculosis (tb) in a subsidized housing community in the lower east side of new york city. you enrolled 500 residents in your study and checked on their tb status on a monthly basis. at the start of your study on january 1st, you screened all 500 residents. upon screening, you found that 30 of the healthy residents had been vaccinated for tb and therefore were not at risk. another 20 residents already had existing cases of tb on january 1st. on february 1st, 5 residents developed tb. on april 1st, 10 more residents developed tb. on june 1st, 10 healthy residents moved away from new york city and were lost to follow-up. on july 1st, 10 of the residents who had existing tb on january 1st died from their disease. the study ended on december 31, 2010. assume that once a person gets tb, they have it for the duration of the study, and assume that all remaining residents stayed healthy and were not lost to follow-up. is the subsidized housing community in the lower east side of new york city a dynamic or fixed population? briefly explain the rationale for your answer. dynamic population it can changeable people can move out and move in into the population of a subsidized housing what was the prevalence of tb in the screened community on january 1st? prevalence = 30/500 0.06= 6% what was the prevalence of tb on june 30th? prevalence= 40/450=0.08= 8.88% what was the cumulative incidence of tb over the year? cumulative incidence = number of new cases/number in candidate population)over specified time period 10/450 = 2.2% suppose that you wanted to calculate the incidence rate of tb in the study population. calculate the amount of person-time that would go in the denominator of this incidence rate. be sure to show your work.
Answers: 2
Do you know the correct answer?
1. Calculate the slope of Graph D. Explain or show your reasoning
2. Calculate the slope of Graph E...
Questions in other subjects:
Mathematics, 29.10.2020 14:00
Mathematics, 29.10.2020 14:00
Mathematics, 29.10.2020 14:00

History, 29.10.2020 14:00

Mathematics, 29.10.2020 14:00
Mathematics, 29.10.2020 14:00
Mathematics, 29.10.2020 14:00


