

Mathematics, 17.12.2020 04:50, beauburgess1108
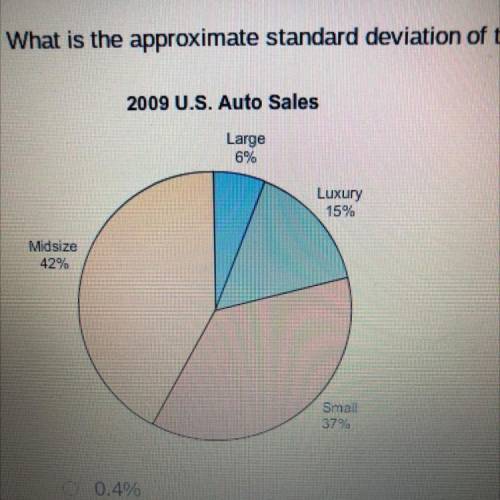
The graph shows the percent of small, midsize, large, and luxury automobiles sold in the United States during 2009. Round your answer
to the nearest tenth of a percent if needed. Suppose a random sample of 90 automobiles sold in the United States in 2009 was taken.
What is the approximate standard deviation of the sampling distribution of the proportion for small autos?

Answers: 1


Other questions on the subject: Mathematics
Mathematics, 21.06.2019 15:00, tejasheree
Flashback to semester a. are triangles pqr and stu congruent? what is the congruency that proves they are congruent? what is the perimeter of triangle pqr? show your work.
Answers: 2
Mathematics, 21.06.2019 20:00, Ap621765
In one day there are too high tides into low tides and equally spaced intervals the high tide is observed to be 6 feet above the average sea level after six hours passed a low tide occurs at 6 feet below the average sea level in this task you will model this occurrence using a trigonometric function by using x as a measurement of time assume the first high tide occurs at x=0. a. what are the independent and dependent variables? b. determine these key features of the function that models the tide: 1.amplitude 2.period 3.frequency 4.midline 5.vertical shift 6.phase shift c. create a trigonometric function that models the ocean tide for a period of 12 hours. d. what is the height of the tide after 93 hours?
Answers: 1
Do you know the correct answer?
The graph shows the percent of small, midsize, large, and luxury automobiles sold in the United Stat...
Questions in other subjects:


Spanish, 16.07.2019 05:30


English, 16.07.2019 05:30
Mathematics, 16.07.2019 05:30
English, 16.07.2019 05:30


