


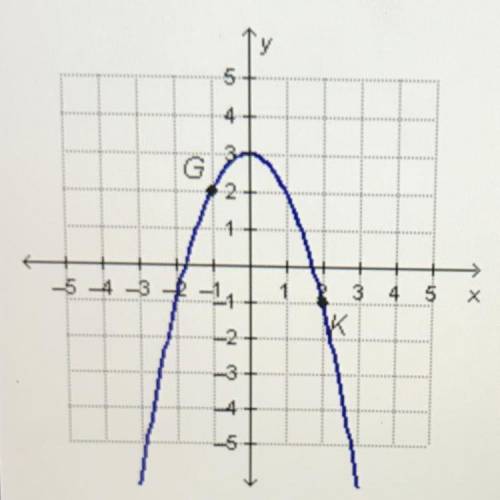
How does the graph change frorm point G to point K?
O The graph increases.
O The graph deceas...

Mathematics, 16.12.2020 20:10, dward5823
How does the graph change frorm point G to point K?
O The graph increases.
O The graph deceases, then increases.
O The graph rernains constant.
OThe araph increases, then decreases.

Answers: 1
Other questions on the subject: Mathematics
Mathematics, 21.06.2019 15:50, annadson4589
Astandard deck of cards contains 52 cards. one card is selected from the deck. (a) compute the probability of randomly selecting a seven or king. (b) compute the probability of randomly selecting a seven or king or jack. (c) compute the probability of randomly selecting a queen or spade.
Answers: 2
Mathematics, 21.06.2019 22:20, wrolle
The volume, v, of a rectangular prism is determined using the formula, where / is the length, w is the width, and his theheight of the prism. carltren solves for w and writes the equivalent equation w=using this formula, what is the width of a rectangular prism that has a volume of 138.24 cubic inches, a height of 9.6 inches, and a length of 3.2 inches?
Answers: 2
Mathematics, 22.06.2019 02:30, misk980
Atrain traveled for 1.5 hours to the first station, stopped for 30 minutes, then traveled for 4 hours to the final station where it stopped for 1 hour. the total distance traveled is a function of time. which graph most accurately represents this scenario? a graph is shown with the x-axis labeled time (in hours) and the y-axis labeled total distance (in miles). the line begins at the origin and moves upward for 1.5 hours. the line then continues upward at a slow rate until 2 hours. from 2 to 6 hours, the line continues quickly upward. from 6 to 7 hours, it moves downward until it touches the x-axis a graph is shown with the axis labeled time (in hours) and the y axis labeled total distance (in miles). a line is shown beginning at the origin. the line moves upward until 1.5 hours, then is a horizontal line until 2 hours. the line moves quickly upward again until 6 hours, and then is horizontal until 7 hours a graph is shown with the axis labeled time (in hours) and the y-axis labeled total distance (in miles). the line begins at the y-axis where y equals 125. it is horizontal until 1.5 hours, then moves downward until 2 hours where it touches the x-axis. the line moves upward until 6 hours and then moves downward until 7 hours where it touches the x-axis a graph is shown with the axis labeled time (in hours) and the y-axis labeled total distance (in miles). the line begins at y equals 125 and is horizontal for 1.5 hours. the line moves downward until 2 hours, then back up until 5.5 hours. the line is horizontal from 5.5 to 7 hours
Answers: 1
Do you know the correct answer?
Questions in other subjects:


Biology, 30.04.2021 17:40
Biology, 30.04.2021 17:40
Biology, 30.04.2021 17:40


