

Mathematics, 16.12.2020 19:50, DanyD8951
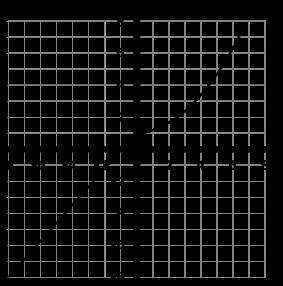
Which of these describes the function graphed below?
There is a linear relationship between x and y when x is less than 0 and a nonlinear relationship when x is greater than 0.
There is a nonlinear relationship between x and y when x is less than 0 and a linear relationship when x is greater than 0.
There is a nonlinear relationship between x and y when x is less than 1 and a linear relationship when x is greater than 1.
There is a linear relationship between x and y when x is less than 1 and a nonlinear relationship when x is greater than 1.

Answers: 1


Other questions on the subject: Mathematics
Mathematics, 21.06.2019 13:20, alexabessin
What additional information could be used to prove that δxyz ≅ δfeg using asa or aas? check all that apply. ∠z ≅ ∠g and xz ≅ fg ∠z ≅ ∠g and ∠y ≅ ∠e xz ≅ fg and zy ≅ ge xy ≅ ef and zy ≅ fg ∠z ≅ ∠g and xy ≅ fe
Answers: 2
Mathematics, 22.06.2019 01:30, bethanybowers4986
Jahdzia wears her winter coat when the temperature is colder than -4 degrees celsius. write an inequality that is true only for temperatures (t) at which jahdzia wears her winter coat.
Answers: 3
Do you know the correct answer?
Which of these describes the function graphed below?
There is a linear relationship between x and y...
Questions in other subjects:
Mathematics, 03.05.2021 17:30


Mathematics, 03.05.2021 17:30

Mathematics, 03.05.2021 17:30


