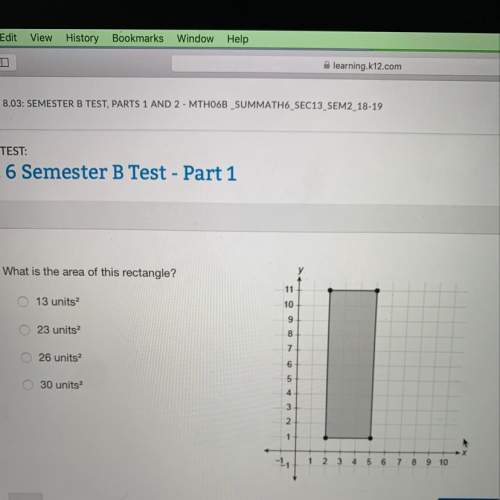
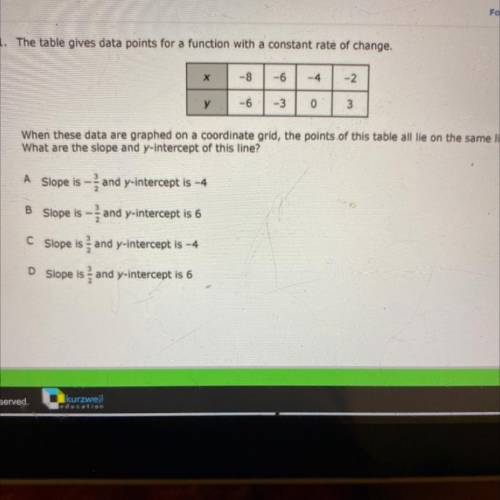
The table gives data points for a function with a constant rate of change.
X
-8
-6
-4
у
-6
-3
0
3
When these data are graphed on a coordinate grid, the points of this table all lie on the same line.
What are the slope and y-intercept of this line?
If $740 is invested at an interest rate of 11% per year and is compounded continuously, how much will the investment be worth in 7 years? use the continuous compound interest formula a = pert.
Atextile fiber manufacturer is investigating a new drapery yarn, which the company claims has a mean thread elongation of 12 kilograms with a standard deviation of 0.5 kilograms. the company wishes to test the hypothesis upper h subscript 0 baseline colon mu equals 12 against upper h subscript 1 baseline colon mu less-than 12 using a random sample of n equals 4 specimens. calculate the p-value if the observed statistic is x overbar equals 11.8. round your final answer to five decimal places (e. g. 98.76543).
Guys i need ! graded assignment grade 8 checkpoint 2, part 2 answer the questions below. when you are finished, submit this assignment to your teacher by the due date for full credit. total score: of 9 points (score for question 1: of 4 points) 1. the cost of renting a car for a day is $0.50 per mile plus a $15 flat fee. (a) write an equation to represent this relationship. let x be the number of miles driven and y be the total cost for the day. (b) what does the graph of this equation form on a coordinate plane? explain. (c) what is the slope and the y-intercept of the graph of the relationship? explain.