


Which of the following equations represents the graph shown?
(1) y = 54
(3) y=(1/2)* +2
...

Mathematics, 16.12.2020 07:20, imknutson962
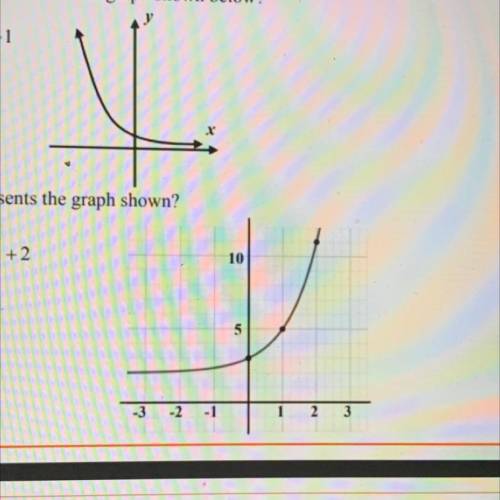
Which of the following equations represents the graph shown?
(1) y = 54
(3) y=(1/2)* +2
(2) y = 4* +1
(4) y = 3* + 2

Answers: 1
Other questions on the subject: Mathematics
Mathematics, 21.06.2019 13:00, nicolescaggs
There is a line with slope 1/a going through the point (a, a²). find the equation of the line perpendicular to this line at this point. (don’t let this problem intimidate you! solve the problem as you would if i’d given you specific values. just use variables instead.)
Answers: 2
Mathematics, 21.06.2019 16:30, jagdeep5533
Which function is odd check all that apply a. y=sin x b. y=csc x c. y=cot x d. y=sec x
Answers: 1
Mathematics, 21.06.2019 16:30, haleylecompte
Mexico city, mexico, is the world's second largest metropolis and is also one of its fastest-growing cities with a projected growth rate of 3.2% per year. its population in 1991 was 20,899,000 people. use the formula p = 20.899e0.032t to predict its population p in millions with t equal to the number of years after 1991. what is the predicted population to the nearest thousand of mexico city for the year 2010?
Answers: 2
Do you know the correct answer?
Questions in other subjects:


English, 25.01.2020 16:31
Mathematics, 25.01.2020 16:31

History, 25.01.2020 16:31


