

Mathematics, 16.12.2020 04:50, rutza
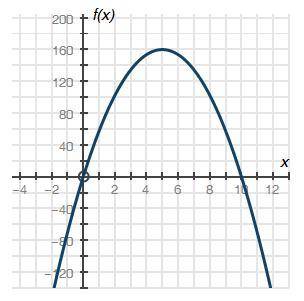
The graph below shows a company's profit f(x), in dollars, depending on the price of pencils x, in dollars, sold by the company:
Part A: What do the x-intercepts and maximum value of the graph represent? What are the intervals where the function is increasing and decreasing, and what do they represent about the sale and profit? (4 points)
Part B: What is an approximate average rate of change of the graph from x = 2 to x = 5, and what does this rate represent? (3 points)
Part C: Describe the constraints of the domain. (3 points)

Answers: 2


Other questions on the subject: Mathematics
Mathematics, 21.06.2019 21:50, rubieceleste548
Rachel is studying the population of a particular bird species in a national park. she observes every 10th bird of that species that she can find in the park. her conclusion is that the birds living in the park who belong to that species generally feed on insects. rachel's sample is . based on the sample she picked, rachel's generalization is . reset next
Answers: 1
Mathematics, 21.06.2019 23:00, jnsoccerboy7260
The perimeter of a rectangular rug is 24 feet. the length of the rug is 1 2/5 i s width. what is the area of the rug
Answers: 2
Do you know the correct answer?
The graph below shows a company's profit f(x), in dollars, depending on the price of pencils x, in d...
Questions in other subjects:


Mathematics, 17.06.2020 18:57

Mathematics, 17.06.2020 18:57
Mathematics, 17.06.2020 18:57
English, 17.06.2020 18:57


