


Question 17
10 pts 5 1 0 Details
A group of students measure the length and width of a random...

Mathematics, 15.12.2020 21:40, dajahp
Question 17
10 pts 5 1 0 Details
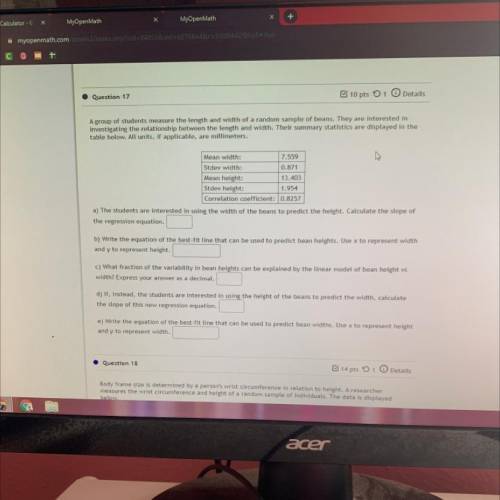
A group of students measure the length and width of a random sample of beans. They are interested in
investigating the relationship between the length and width. Their summary statistics are displayed in the
table below. All units, if applicable, are millimeters.
Mean width:
7.559
Stdev width:
0.871
Mean height:
13.403
Stdev height:
1.954
Correlation coefficient: 0.8257
a) The students are interested in using the width of the beans to predict the height. Calculate the slope of
the regression equation.
b) Write the equation of the best fit line that can be used to predict bean heights. Use x to represent width
and y to represent height.
c) What fraction of the variability in bean heights can be explained by the linear model of bean height vs
width? Express your answer as a decimal.
d) If, instead, the students are interested in using the height of the beans to predict the width, calculate
the slope of this new regression equation.
e) Write the equation of the best-fit line that can be used to predict bean widths. Use x to represent height
and y to represent width.

Answers: 1
Other questions on the subject: Mathematics
Mathematics, 21.06.2019 17:50, domiyisthom
On a string instrument, the length of a string varies inversely as the frequency of its vibrations. an 11-inch string has a frequency of 400 cylces per second. find the frequency of a 10-icnch string.
Answers: 2
Mathematics, 21.06.2019 21:30, adam15200031
Yesterday, george drank 1 small bottle and 2 large bottles, for a total of 1,372 grams. the day before , he drank 1 small bottle and 1 large bottle, for the total of 858 grams. how many grams does each bottle hold?
Answers: 1
Do you know the correct answer?
Questions in other subjects:
Mathematics, 08.10.2021 04:00

Social Studies, 08.10.2021 04:00

World Languages, 08.10.2021 04:00

Chemistry, 08.10.2021 04:00
Mathematics, 08.10.2021 04:00

History, 08.10.2021 04:00
Mathematics, 08.10.2021 04:00

English, 08.10.2021 04:00


