


Consider the plot created from the residuals of a line
of best fit for a set of data.
...

Mathematics, 15.12.2020 19:00, lilyella06
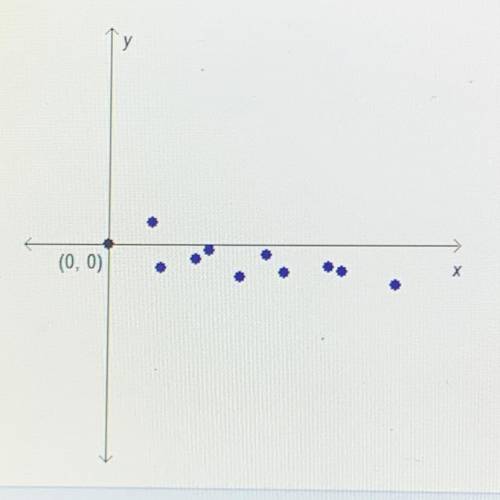
Consider the plot created from the residuals of a line
of best fit for a set of data.
Does the residual plot show that the line of best fit is
appropriate for the data?
O Yes, the points have no pattern,
O Yes, the points are evenly distributed about the x-
axis
O No, the points are in a linear pattern,
O No, the points are in a curved pattern.

Answers: 1
Other questions on the subject: Mathematics
Mathematics, 21.06.2019 16:00, dayanawhite64
Which term best describes the association between variables a and b? no association a negative linear association a positive linear association a nonlinear association a scatterplot with an x axis labeled, variable a from zero to ten in increments of two and the y axis labeled, variable b from zero to one hundred forty in increments of twenty with fifteen points in a positive trend.
Answers: 2
Mathematics, 21.06.2019 16:30, sjaybanks4067
Asequence {an} is defined recursively, with a1 = 1, a2 = 2 and, for n > 2, an = an-1 an-2 . find the term a241
Answers: 2
Mathematics, 21.06.2019 17:30, lamanihill
Aplot of land is shaped like a quadrilateral. fences are built on the diagonal to divide the area into 4 sections. what is vi to the nearest tenth? gv = 6.55fv = 5.84vh = 3.27vi = ?
Answers: 1
Mathematics, 21.06.2019 18:10, jaimejohnston2
What is the ratio for the surface areas of the cones shown below, given that they are similar and that the ratio of their radil and altitudes is 4: 3? 23
Answers: 1
Do you know the correct answer?
Questions in other subjects:


Social Studies, 25.11.2021 07:10


History, 25.11.2021 07:10


